








Supply and demand defines the trucking industry. Demand can be approximated by volumes. Supply is a function of capacity, or the number of fleets and tractors in the market. Rates, both spot and contract, are a function of the intersection between supply and demand.
If, all else being equal, demand rises via growing truckload volumes, but the number of tractors in the market does not rise proportionately to demand, we would expect rates to rise to compensate for the lack of capacity. Conversely, if truckload volumes begin to contract and the supply of tractors in the market does not fall proportionately, we would expect rates to fall.
At FreightWaves, we track capacity primarily through national outbound tender rejections (SONAR: OTRI.USA). Tender rejections are the percentage of electronic, contracted loads offered by shippers to carriers that are rejected. There are two primary reasons why carriers will begin to increasingly reject loads.
- First, they literally may be at full utilization and not have any excess capacity to take on the load.
- Or, second, carriers may reject a load if they have more attractive alternatives available in the form of higher rates in the spot market or from another broker or shipper.
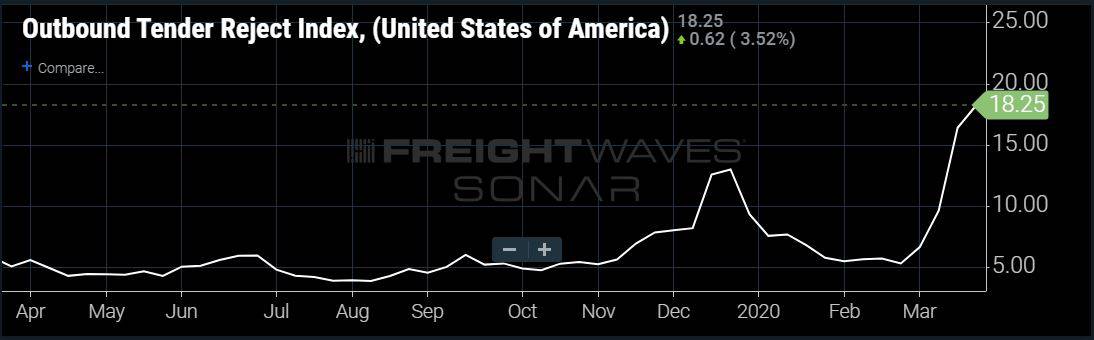
Tender rejections are often a leading indicator of spot rates and thus contract rates at a lag. FreightWaves has been tracking national outbound tender rejections since January 2018 (see chart below). Tracking tender rejections over time can tell us if we are in a loose, balanced or tight trucking market. 2018 was defined by very tight capacity in which tender rejections averaged double digits for the entirety of the year and reached nearly 30% early in the year. Conversely, 2019 was mostly defined by a freight recession in which national outbound tender rejections spent the first three quarters of the year hovering at around 5%, reaching a low of 3.75% in the spring.
Perhaps most importantly, it is vital to track capacity because it is one of the best leading indicators in trucking and tells us how much money the trucking industry is likely to be making (or losing). This is because capacity tends to move almost perfectly inversely to spot rates. As capacity tightens and tender rejections increase, spot rates tend to move up and vice versa.
Generally, but not always, tender rejections will be rising due to rising demand and volumes. However, for example, this is not true in the event of a supply disruption, such as a snowstorm or a hurricane where demand does not rise as fast as supply exits. Also, there are times when tender rejections and capacity can tighten in a flat market for volumes if supply exits the industry due to bankruptcies, rising insurance premiums or new Class 8 truck orders running below replacement demand.
In terms of percentage ranges for demarcating a tight, balanced and loose market, as a rough rule, a loose market is defined by tender rejections in the low- to mid-single-digit range, a balanced market by tender rejections in the high single digits, and a tight market by tender rejections above 10%.
As of late March 2020, national outbound tender rejections stand at nearly 18%, roughly three times higher than the 6% tender rejections at this time last year. Tender rejections have risen sharply in early March (from 5% to 18% in a matter of weeks) as panic-buying due to COVID-19 has caused a dramatic increase in outbound tender volumes (SONAR: OTVI.USA) of 29% as grocery stores scurry to restock empty shelves. Accordingly, spot rates have risen by roughly 10% nationally to $1.42 per mile to compensate for the tightening capacity and rising demand.
Tender rejections and 150,000 indexes are updated every day to SONAR. If you are interested in learning more about SONAR or scheduling a demo, click here.
Brokerage Compliance Symposium
The day before F3. Every compliance issue you face - fraud exposure, carrier liability, FMCSA rules, cargo theft, insurance gaps - navigated by attorneys and operators defining best practices in a changing industry.
F3 Awards Dinner
The night before F3. FreightTech100 companies honored. FreightTech 25 and Shipper of Choice winners revealed live. Cocktail reception into dinner and live music - 300 industry leaders in one purpose-built room.
F3: Future of Freight Festival
Industry-defining keynotes, rapid-fire technology demos, and industry leaders networking in experiences across Chattanooga - plus the inaugural F3 Awards Dinner featuring the FreightTech and Shipper of Choice reveals.
The day before F3. Every compliance issue you face - fraud exposure, carrier liability, FMCSA rules, cargo theft, insurance gaps - navigated by attorneys and operators defining best practices in a changing industry.
The Signal at Chattanooga Choo Choo • Chattanooga, TN Register NowThe night before F3. FreightTech100 companies honored. FreightTech 25 and Shipper of Choice winners revealed live. Cocktail reception into dinner and live music - 300 industry leaders in one purpose-built room.
The Signal at Chattanooga Choo Choo • Chattanooga, TN Register NowIndustry-defining keynotes, rapid-fire technology demos, and industry leaders networking in experiences across Chattanooga - plus the inaugural F3 Awards Dinner featuring the FreightTech and Shipper of Choice reveals.
The Signal at Chattanooga Choo Choo • Chattanooga, TN Register Now