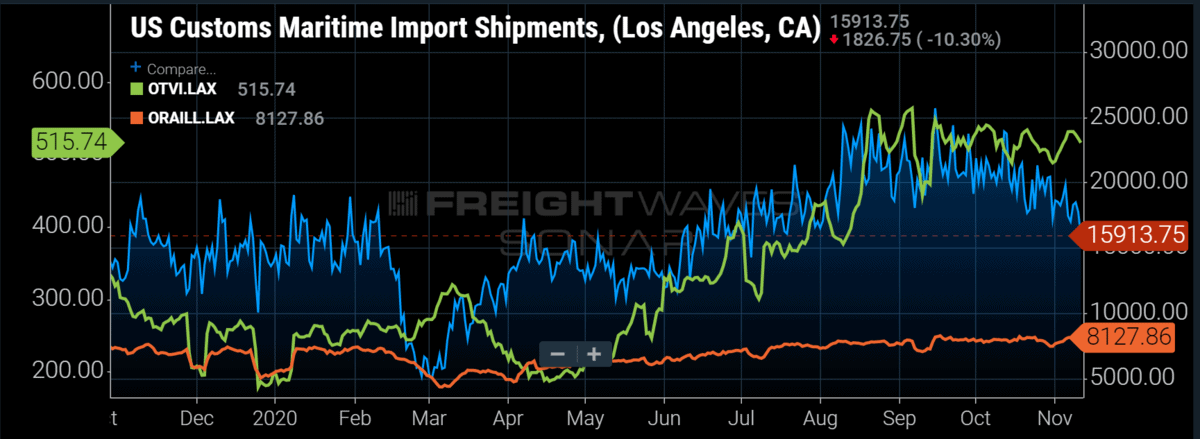
Chart of the Week: Customs Import Shipments, Outbound Tender Volume Index, Outbound Loaded Rail Containers – Los Angeles SONAR: CSTM.LAX, OTVI.LAX, ORAILL.LAX
Daily U.S. import shipments clearing the ports of Los Angeles and Long Beach have been trending lower over the past eight weeks after peaking in early September. Import shipment volumes have exceeded the previous two years consistently since about mid-July. These figures are starting to move closer to the previous year, which should mean easing demand for surface transportation providers, but it has not as of yet.
Daily truckload tender volumes represented by the Outbound Tender Volume Index (OTVI) for the Los Angeles market have been hovering around the 515 mark since mid-September. The amount of tenders that have been rejected has dropped slightly from around 26% to 24% over the same time period, indicating daily accepted volumes have actually increased.
Loaded container volumes moving on the rail (ORAILL) fell slightly after the Labor Day surge but have trended higher since the middle of October out of Los Angeles. Other than a slight dip around Halloween from the international container volumes, which are heavily tied to maritime imports, the amount of containers moving out of Southern California on the rails has been consistent.
In a previous chart of the week, we wrote about the connection that has been formed between imports and truckload movements as warehouse capacity tightens and shippers struggle to keep inventory levels adequate to meet the unexpected recovery in demand for many items. Over the past month, that strong near-time connection to import volume patterns has broken.
This does not mean that imports and surface freight are completely disconnected from each other. Transportation capacity at full employment can only handle so much at a time. Capacity does not increase quickly and may be even more lagged thanks to the disruptions to driver schools and other employment opportunities like construction being available. Carriers have also been hesitant to add to their fleets, which is understandable after several large carriers rushed to order new equipment as spot rates jumped in 2018.
Seeing rail container volumes — specifically domestic containers — remain steady is an indication of backlogs and port congestion. It was inevitable for freight volumes coming across the ocean to recede from their record levels in September. Domestic capacity has not been able to keep up with the demand and it may take a bit longer to clear the backlog. So could this mean the beginning of the end of the 2020 freight boom?
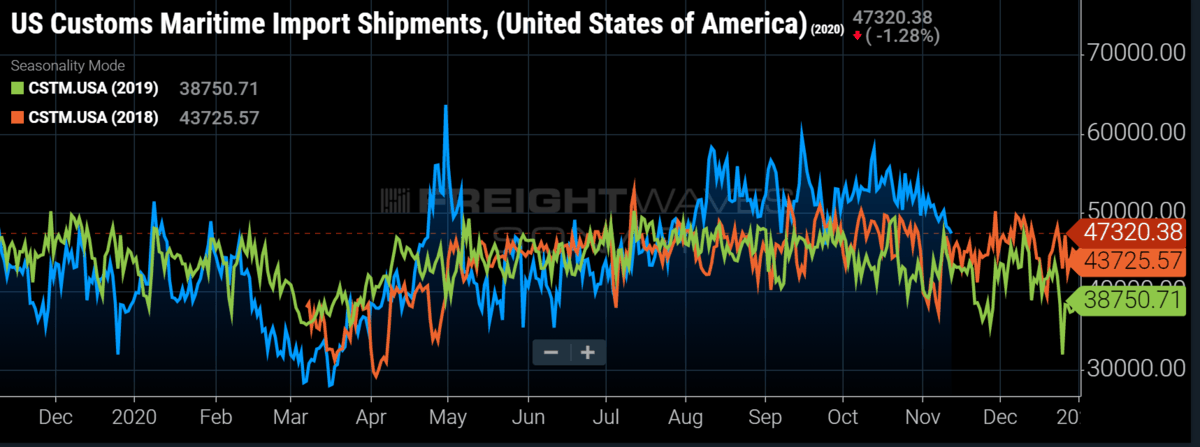
Looking at import shipment volumes compared to the previous two years, we are still seeing numbers exceeding 2018 and 2019, even though they are moving closer together. But looking at the FreightWaves TEU Volume Index, we are still expecting a 50% increase in TEUs leaving their ports of origin over the next seven days, which is freight that will not hit the U.S. for 12 to 21 days.
Even with shipment volumes sliding over the past several weeks, future demand continues to look stronger than a year ago and the backlog of freight to move along with the holidays still supports a strong finish to 2020 for transportation providers with a decent start to 2021.
About the Chart of the Week
The FreightWaves Chart of the Week is a chart selection from SONAR that provides an interesting data point to describe the state of the freight markets. A chart is chosen from thousands of potential charts on SONAR to help participants visualize the freight market in real time. Each week a Market Expert will post a chart, along with commentary, live on the front page. After that, the Chart of the Week will be archived on FreightWaves.com for future reference.
SONAR aggregates data from hundreds of sources, presenting the data in charts and maps and providing commentary on what freight market experts want to know about the industry in real time.
The FreightWaves data science and product teams are releasing new data sets each week and enhancing the client experience.
To request a SONAR demo, click here.
Brokerage Compliance Symposium
The day before F3. Every compliance issue you face - fraud exposure, carrier liability, FMCSA rules, cargo theft, insurance gaps - navigated by attorneys and operators defining best practices in a changing industry.
F3 Awards Dinner
The night before F3. FreightTech100 companies honored. FreightTech 25 and Shipper of Choice winners revealed live. Cocktail reception into dinner and live music - 300 industry leaders in one purpose-built room.
F3: Future of Freight Festival
Industry-defining keynotes, rapid-fire technology demos, and industry leaders networking in experiences across Chattanooga - plus the inaugural F3 Awards Dinner featuring the FreightTech and Shipper of Choice reveals.
The day before F3. Every compliance issue you face - fraud exposure, carrier liability, FMCSA rules, cargo theft, insurance gaps - navigated by attorneys and operators defining best practices in a changing industry.
The Signal at Chattanooga Choo Choo • Chattanooga, TN Register NowThe night before F3. FreightTech100 companies honored. FreightTech 25 and Shipper of Choice winners revealed live. Cocktail reception into dinner and live music - 300 industry leaders in one purpose-built room.
The Signal at Chattanooga Choo Choo • Chattanooga, TN Register NowIndustry-defining keynotes, rapid-fire technology demos, and industry leaders networking in experiences across Chattanooga - plus the inaugural F3 Awards Dinner featuring the FreightTech and Shipper of Choice reveals.
The Signal at Chattanooga Choo Choo • Chattanooga, TN Register Now