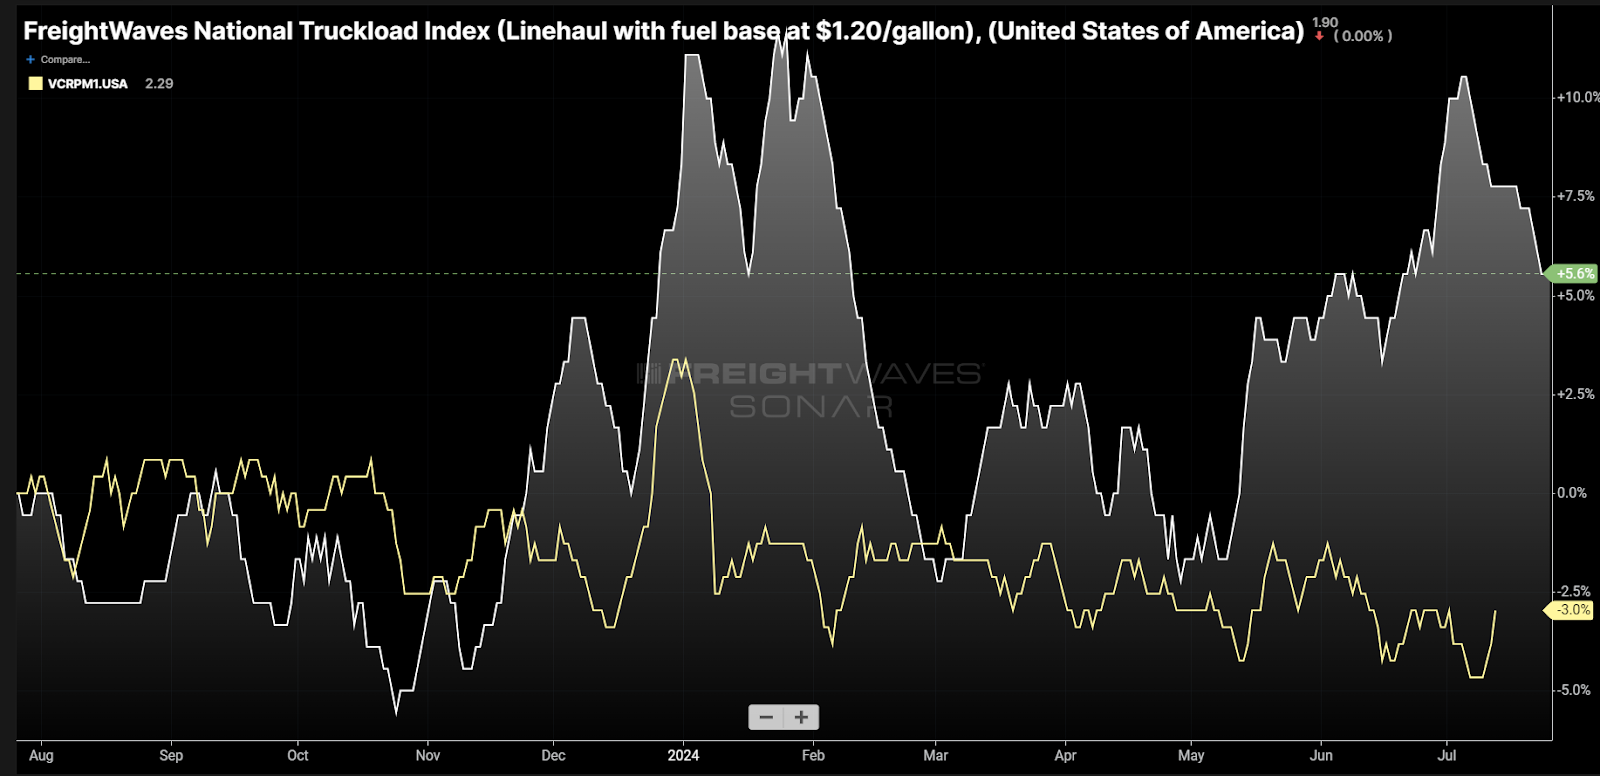
Chart of the Week: National Truckload Index (less estimated fuel cost above $1.20/gal), Van Contract Base Rate per Mile Initial Report – USA SONAR: NTIL12.USA, VCRPM1.USA
The average long-term (contract) rate for dry van truckloads (yellow) has dropped about 3%-5% since July 2023, according to FreightWaves invoice data. The more short-term focused-spot rate (white) is moving in the opposite direction, increasing around 5%-6% y/y. The spot market is still offering strong discounts to contract rates in general — the chart is a relative view and measuring percentage change from the start — but those discounts are shrinking as we approach bid season. What does this mean for future contracts?
Having an understanding of the fundamental differences between the truckload spot and contract markets is necessary for this exercise. What exactly is the contract rate index in the chart (VCRPM1) measuring?
The Van Contract Base Rate Per Mile Index measures the average rate of dry van load invoices paid by shippers for loads that move more than 250 miles or half a day’s drive from origin. These invoices heavily lean toward the direct shipper-to-carrier relationship for rates negotiated for a long period (three months to two years) without an intermediary. This is an important distinction.
Many 3PLs offer managed transportation services where they offer contract rates to shippers, sourcing from their base of multiple carriers. Because these rates are an amalgamation of multiple carriers in each lane, they tend to track more along the lines of spot rates.
3PLs also can generally leverage a much wider carrier base than shippers can in each lane as this is their primary business, which also keeps managed transportation rates lower on average. Transportation managers tend to prefer fewer carriers, whereas 3PLs are constantly pursuing providers.
VCRPM1 better tracks the pricing direction of contracts on an individual carrier basis because of this.
Contract rates have been slowing in their decline. Contract rates were coming in 8%-10% lower y/y in January and February. The rapidly diminishing rate of decline is a sign that carriers have nearly run out of room to drop prices and remain in business.
Another important note is that invoice data lags the negotiation, meaning new contracts are likely coming in with even less downward pressure. In other words, look at the contract rates as slow and lagging to the current market conditions.
On the spot
The National Truckload Index (excluding estimated fuel costs above $1.20 a gallon) measures the average rate that is negotiated for dry van loads on a transactional or ad hoc basis with no long-term implications for carriers honoring that rate for any loads moving outside of the immediate future, generally less than a few days.
The spot market represents 15%-30% of the truckload market volume. Its rates are volatile and often reflect an exaggeration of the current market conditions. They are very seasonal but can be a faster indicator of a changing freight market.
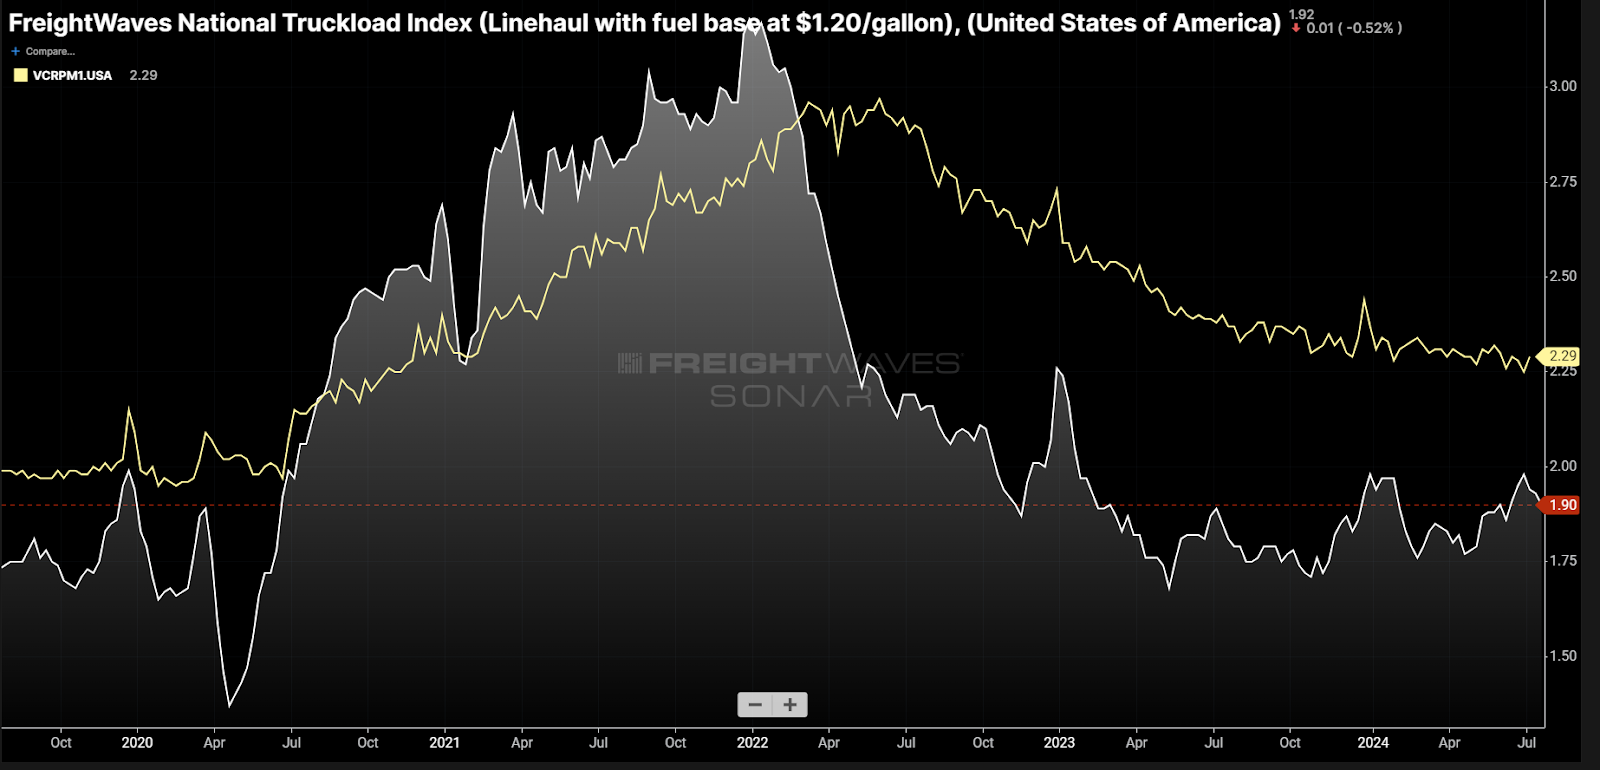
Looking at the past five-year relationship between these two indices on an absolute scale can help with understanding their relationship. Spot rates tend to operate below contract rates during nonholiday periods. This is due to the fact that they are skewed toward backhaul and brokered loads.
Backhaul freight gets carriers out of an area where there is little freight demand relative to the available supply of carriers to one where there are more load-carrying opportunities. Carriers offer to carry freight below their operating costs in these lanes to get the chance to make it up in another more favorable area.
3PLs do not rely on having their own assets or trucks to carry customers’ freight. Most of their time is spent negotiating with shippers and carriers and they have an overweight involvement on the spot market. Their influence means that spot rates move first and fast as their visibility is large.
The approximately 5% y/y spot rate increase is not large enough to say the market has hit a point of extreme vulnerability. The slowing decline of contract rates is probably the more notable figure. Both are signaling some form of cost inflation returning to the truckload market is near.
About the Chart of the Week
The FreightWaves Chart of the Week is a chart selection from SONAR that provides an interesting data point to describe the state of the freight markets. A chart is chosen from thousands of potential charts on SONAR to help participants visualize the freight market in real time. Each week a Market Expert will post a chart, along with commentary, live on the front page. After that, the Chart of the Week will be archived on FreightWaves.com for future reference.
SONAR aggregates data from hundreds of sources, presenting the data in charts and maps and providing commentary on what freight market experts want to know about the industry in real time.
The FreightWaves data science and product teams are releasing new datasets each week and enhancing the client experience.
To request a SONAR demo, click here.
Brokerage Compliance Symposium
The day before F3. Every compliance issue you face - fraud exposure, carrier liability, FMCSA rules, cargo theft, insurance gaps - navigated by attorneys and operators defining best practices in a changing industry.
F3 Awards Dinner
The night before F3. FreightTech100 companies honored. FreightTech 25 and Shipper of Choice winners revealed live. Cocktail reception into dinner and live music - 300 industry leaders in one purpose-built room.
F3: Future of Freight Festival
Industry-defining keynotes, rapid-fire technology demos, and industry leaders networking in experiences across Chattanooga - plus the inaugural F3 Awards Dinner featuring the FreightTech and Shipper of Choice reveals.
The day before F3. Every compliance issue you face - fraud exposure, carrier liability, FMCSA rules, cargo theft, insurance gaps - navigated by attorneys and operators defining best practices in a changing industry.
The Signal at Chattanooga Choo Choo • Chattanooga, TN Register NowThe night before F3. FreightTech100 companies honored. FreightTech 25 and Shipper of Choice winners revealed live. Cocktail reception into dinner and live music - 300 industry leaders in one purpose-built room.
The Signal at Chattanooga Choo Choo • Chattanooga, TN Register NowIndustry-defining keynotes, rapid-fire technology demos, and industry leaders networking in experiences across Chattanooga - plus the inaugural F3 Awards Dinner featuring the FreightTech and Shipper of Choice reveals.
The Signal at Chattanooga Choo Choo • Chattanooga, TN Register Now