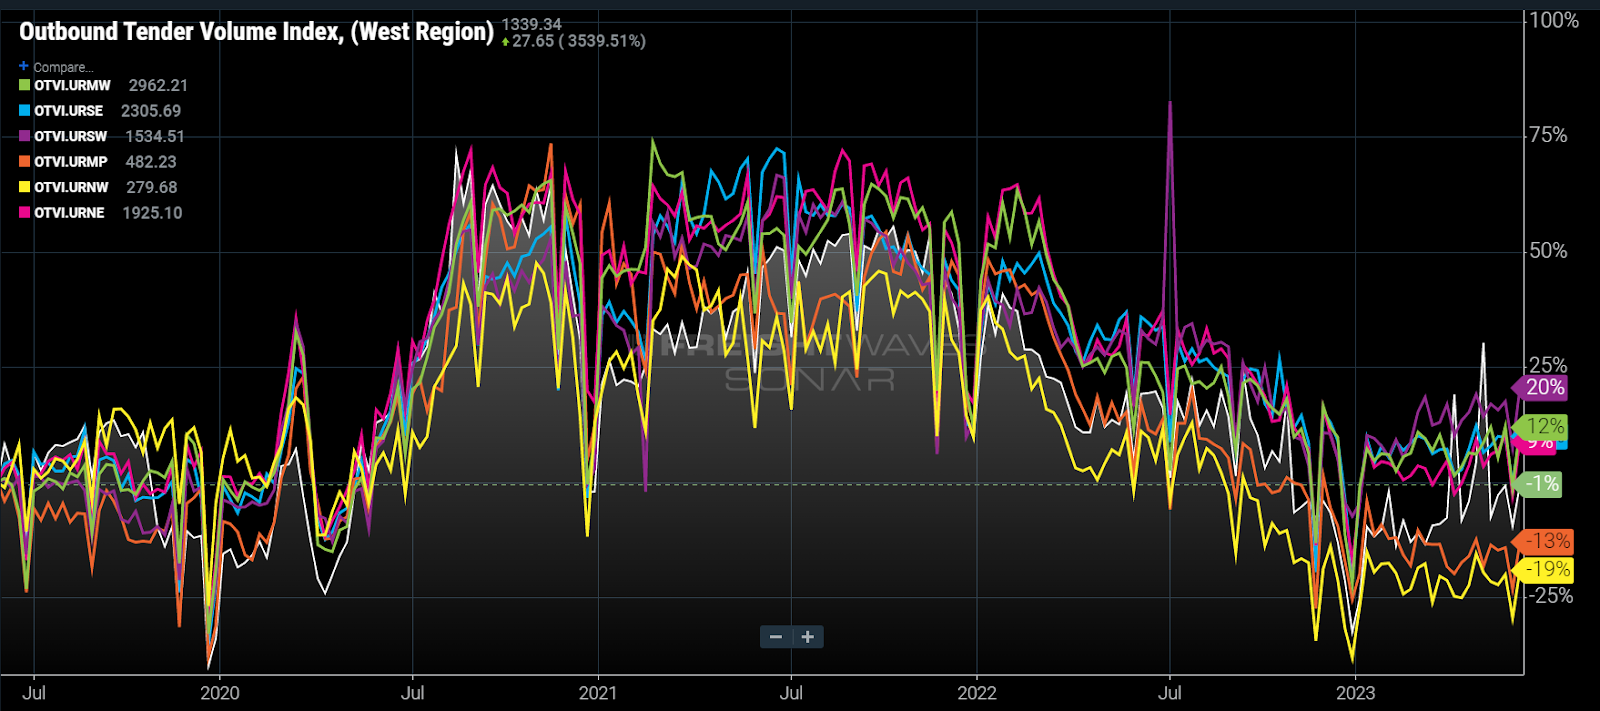
Chart of the Week: Outbound Tender Volume – by region SONAR: OTVI.URWT, OTVI.URSW, OTVI.URNE, OTVI.URSE, OTVI.URNW, OTVI.URMP, OTVI.URNW
Compared to June 2019, regional outbound freight demand has shifted noticeably to the Eastern half of the U.S. based on shipper requests for capacity (OTVI). The Southwest region, which includes Texas, has captured most of the growth while the freight-starved Northwest has deteriorated the most in terms of percentage change.
Some of this movement could be attributed to the post-pandemic economic fallout as supply chains become unkinked and consumption patterns stabilize. But there is definitely a sustainable shift in how freight is distributed domestically.
First off, we have to acknowledge that we tend to talk about 2019 like it was last year due to the fact that it was what many consider the last “normal” year before COVID-19 took us on a wild economic roller coaster ride. It was in fact four years ago, meaning that even during stable periods, patterns change over such a length of time — although the pandemic has definitely accelerated this recent shift.
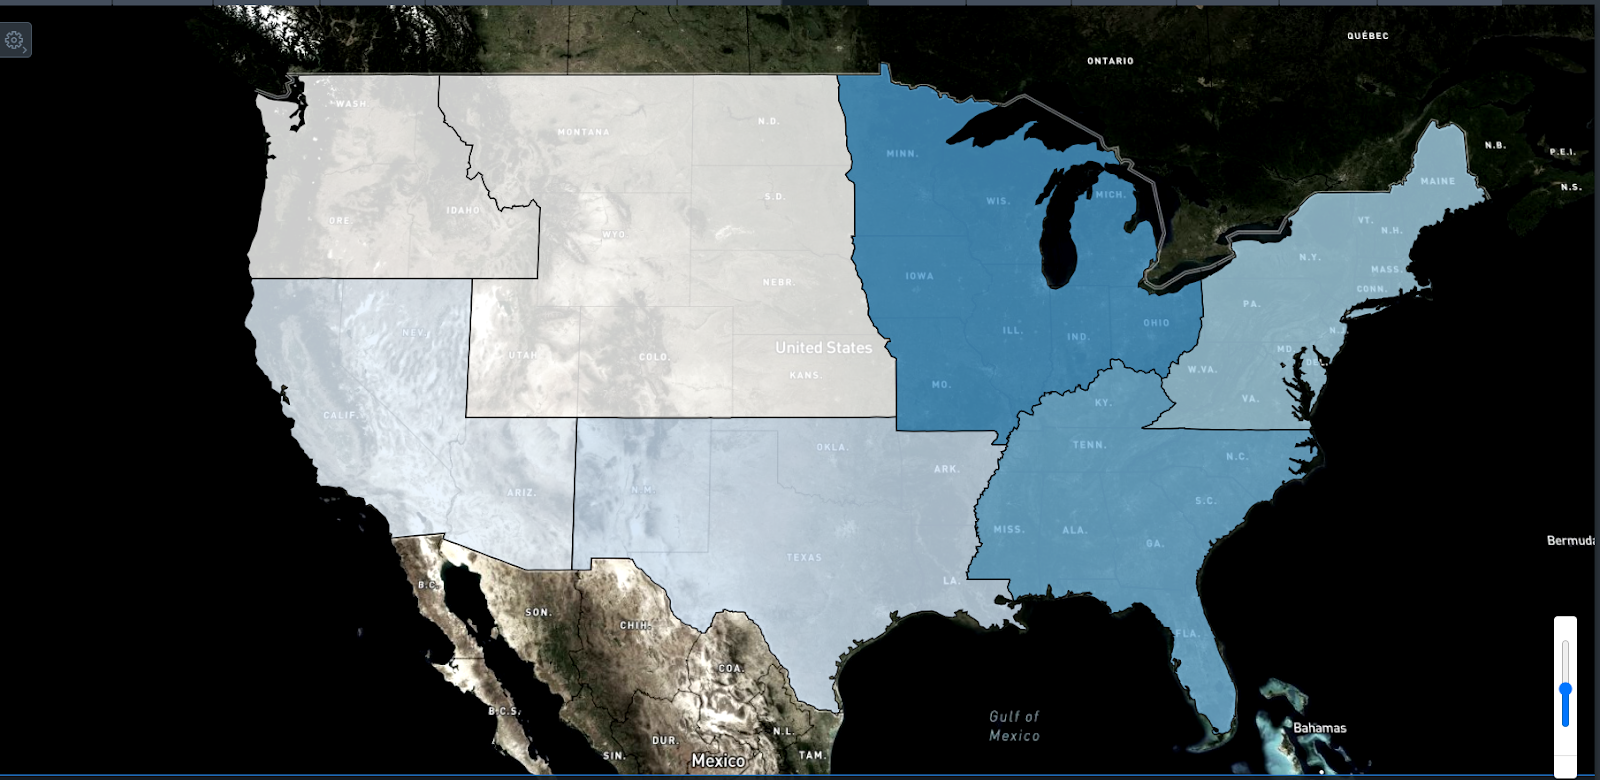
The heat map above shows each region color-coded from darkest blue (highest outbound demand) to white (lowest outbound demand). The Midwest originates the most freight, with the Northwest and Mountain Prairie regions having the least.
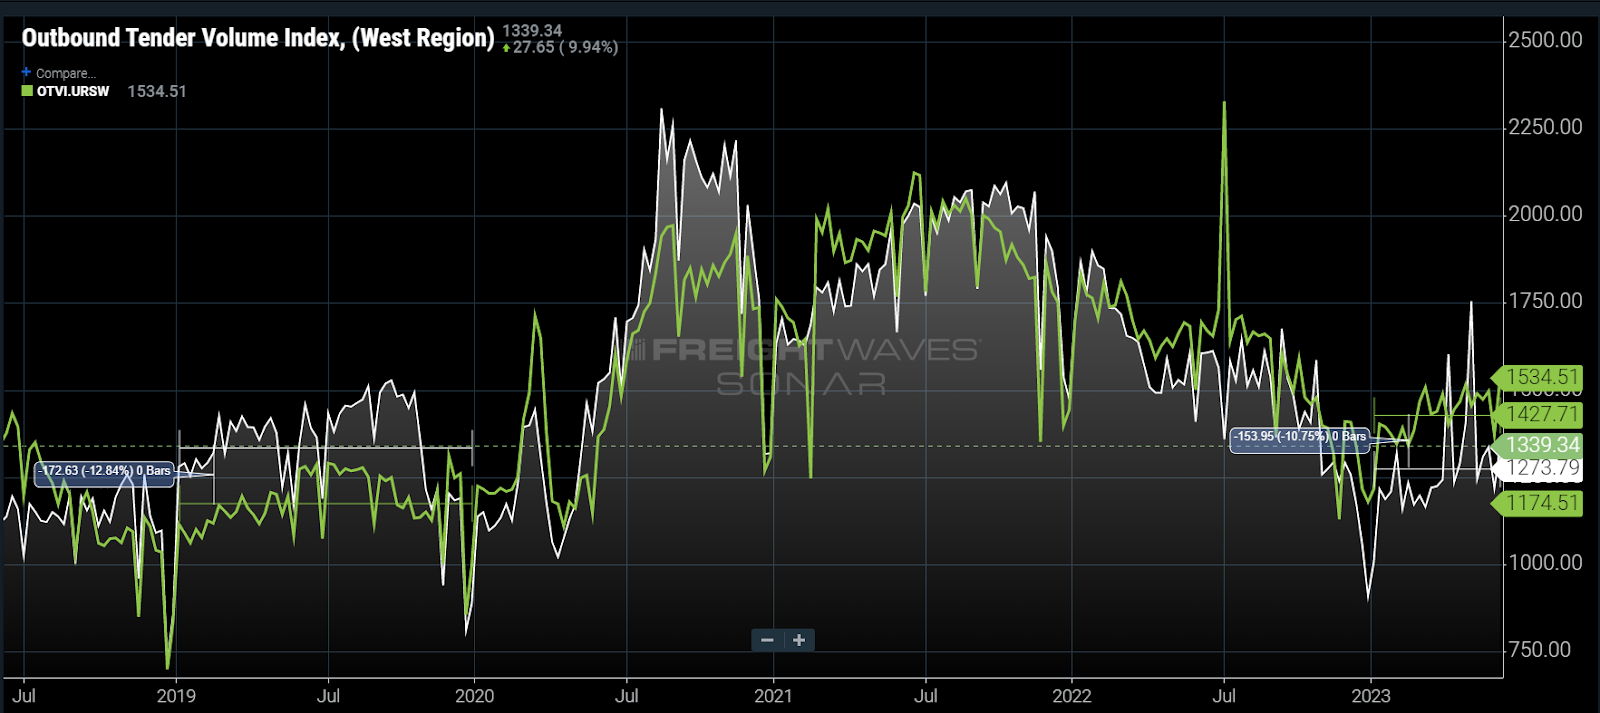
The Southwest region averaged about 11% less demand in 2019 than the West Coast. That has flipped in the first half of 2023.
Inventory offloading
Inventory correction probably accounts for a certain portion of the shift as many companies have slowed their ordering now that they can receive goods on a more predictable cadence and consumption has slowed.
This activity would naturally reduce the amount of freight coming out of the West since that is the nation’s largest entry point for goods from overseas. While there are still many companies with inventory to shed, the nation’s largest retailers are reportedly close to being where they want to be.
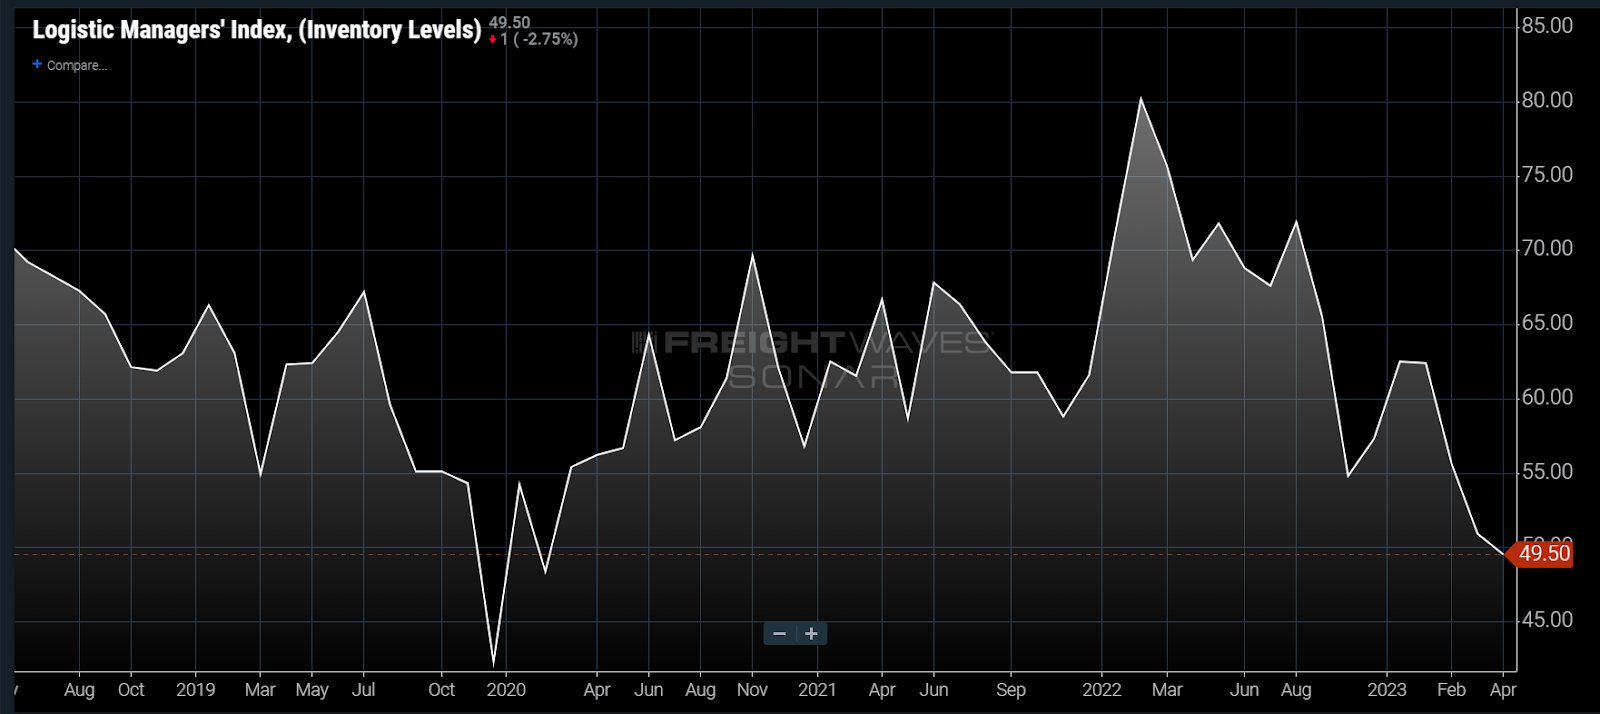
The latest Logistics Managers’ Index inventory level component shows a slight contraction with a value of 49.5 — values below 50 show contraction, those above 50 show expansion. That’s a stark contrast to a year ago when they were expanding rapidly with values over 70.
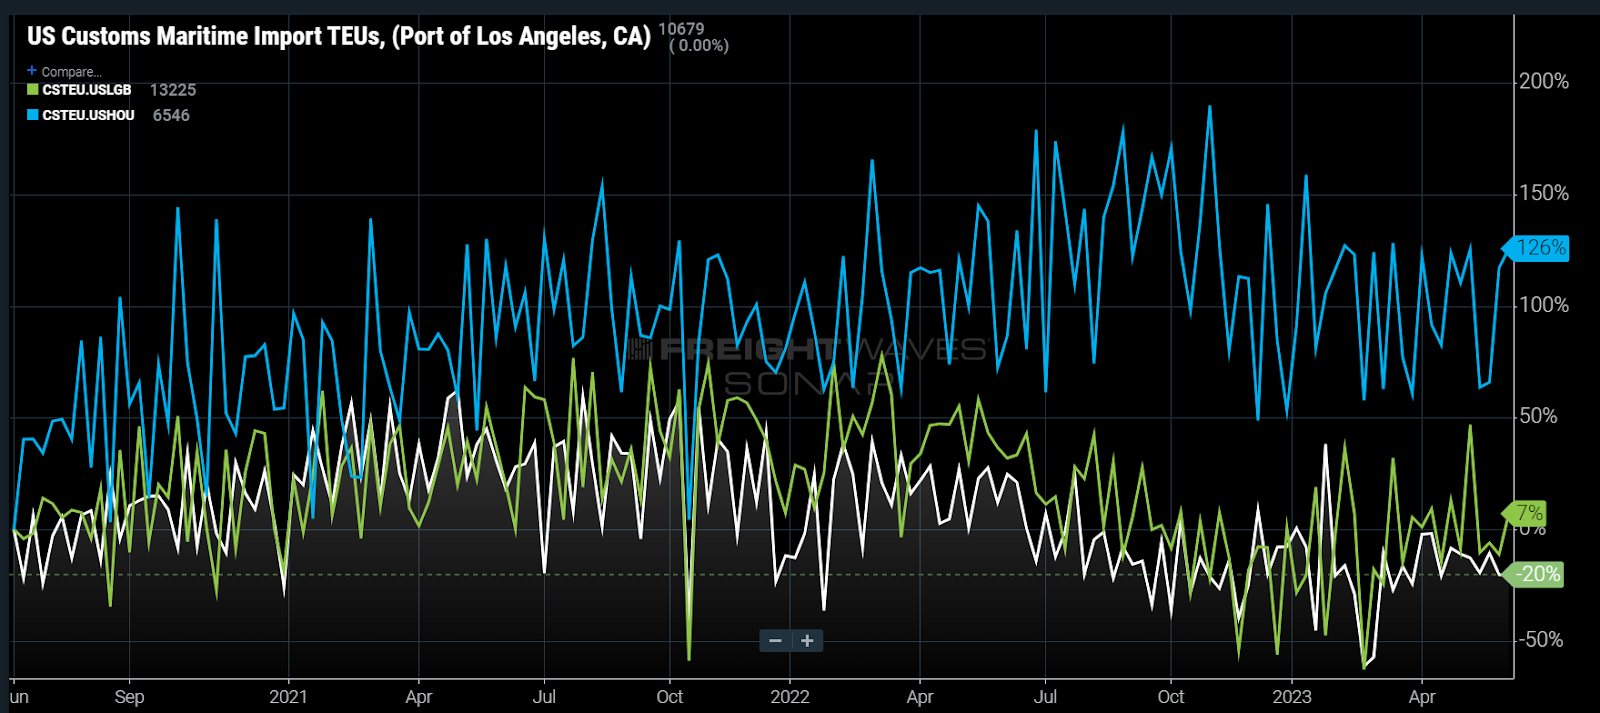
Now that inventories are more in line with demand, some of the ordering patterns have remained relatively sticky. Looking at customs data that measures container volumes entering the ports, Port Houston inbound container volumes (CSTEU.USHOU) have doubled versus June 2019. The Southern California ports of Long Beach (CSTEU.USLGB) and Los Angeles (CSTEU.USLAX) have contracted when added together.
Diversification redistributes freight
There is a push for supply chain diversification in the post-pandemic world. Procurement teams are being pushed to find multiple sources to hedge their exposure to risk of supply chain disruptions. One of the byproducts of this is freight patterns shifting away from what has been the predominant path for the flow of goods in the U.S.
There is certainly more nuance to this outside of the West Coast demand erosion. Within the region itself, patterns are also changing.
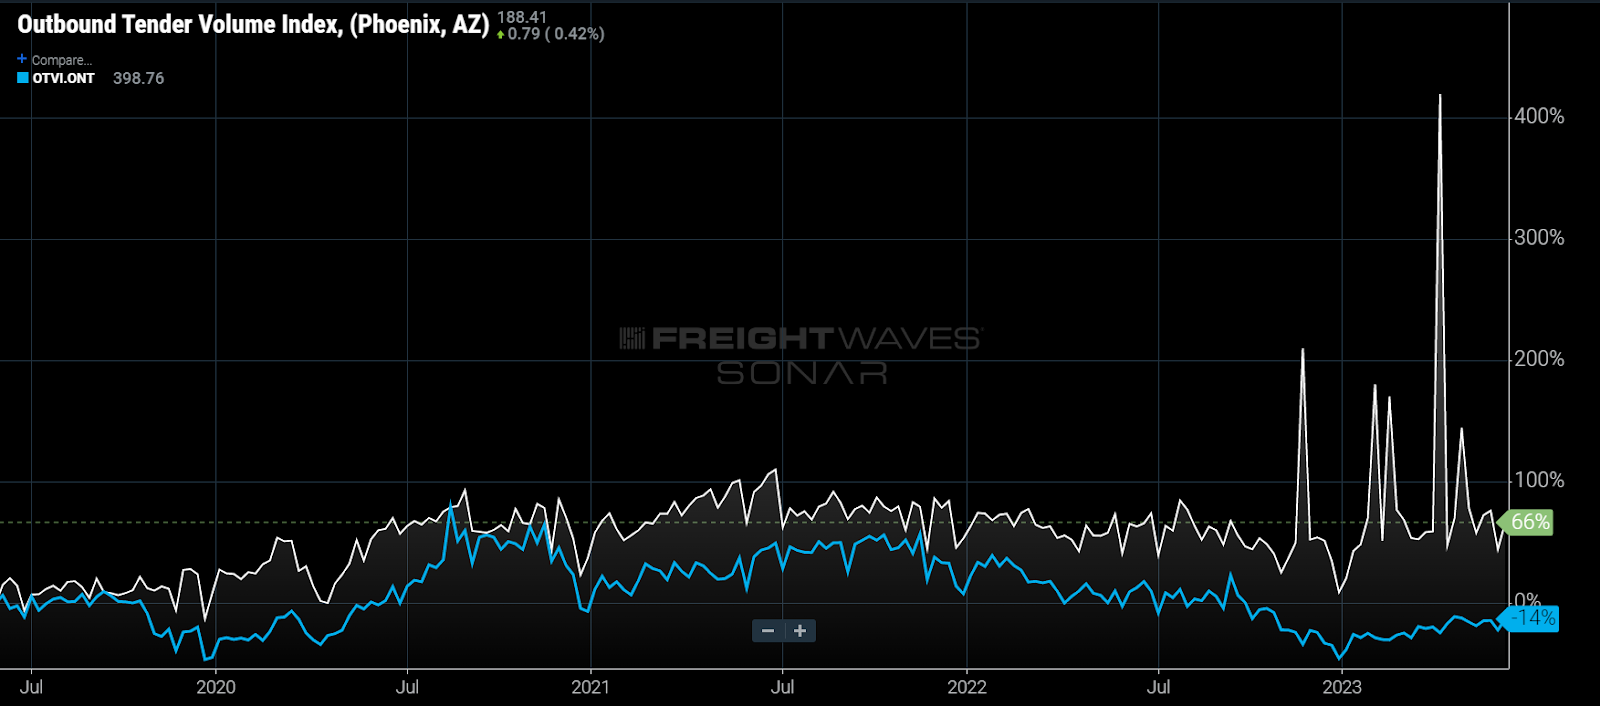
Phoenix, once a market where carriers could not buy freight to carry, is an up-and-coming outbound market, though inbound volumes still outweigh the outbound. Outbound tender volumes for Phoenix are up 66% versus June 2019, while the distribution-centric Ontario, California, market has eroded 14%. If this trend continues, the once easy-to-manage market may be more exposed to service risks.
The bottom line is even in an extremely loose trucking market, underlying changes are occurring. Once capacity falls into closer alignment with demand, transportation providers may have some new puzzles to solve in network management. Transportation managers will want to monitor these pattern changes to be ahead of their service and cost risks.
About the Chart of the Week
The FreightWaves Chart of the Week is a chart selection from SONAR that provides an interesting data point to describe the state of the freight markets. A chart is chosen from thousands of potential charts on SONAR to help participants visualize the freight market in real time. Each week a Market Expert will post a chart, along with commentary, live on the front page. After that, the Chart of the Week will be archived on FreightWaves.com for future reference.
SONAR aggregates data from hundreds of sources, presenting the data in charts and maps and providing commentary on what freight market experts want to know about the industry in real time.
The FreightWaves data science and product teams are releasing new datasets each week and enhancing the client experience.
To request a SONAR demo, click here.
Brokerage Compliance Symposium
The day before F3. Every compliance issue you face - fraud exposure, carrier liability, FMCSA rules, cargo theft, insurance gaps - navigated by attorneys and operators defining best practices in a changing industry.
F3 Awards Dinner
The night before F3. FreightTech100 companies honored. FreightTech 25 and Shipper of Choice winners revealed live. Cocktail reception into dinner and live music - 300 industry leaders in one purpose-built room.
F3: Future of Freight Festival
Industry-defining keynotes, rapid-fire technology demos, and industry leaders networking in experiences across Chattanooga - plus the inaugural F3 Awards Dinner featuring the FreightTech and Shipper of Choice reveals.
The day before F3. Every compliance issue you face - fraud exposure, carrier liability, FMCSA rules, cargo theft, insurance gaps - navigated by attorneys and operators defining best practices in a changing industry.
The Signal at Chattanooga Choo Choo • Chattanooga, TN Register NowThe night before F3. FreightTech100 companies honored. FreightTech 25 and Shipper of Choice winners revealed live. Cocktail reception into dinner and live music - 300 industry leaders in one purpose-built room.
The Signal at Chattanooga Choo Choo • Chattanooga, TN Register NowIndustry-defining keynotes, rapid-fire technology demos, and industry leaders networking in experiences across Chattanooga - plus the inaugural F3 Awards Dinner featuring the FreightTech and Shipper of Choice reveals.
The Signal at Chattanooga Choo Choo • Chattanooga, TN Register Now