Seasonal tightening largely absent from industry numbers
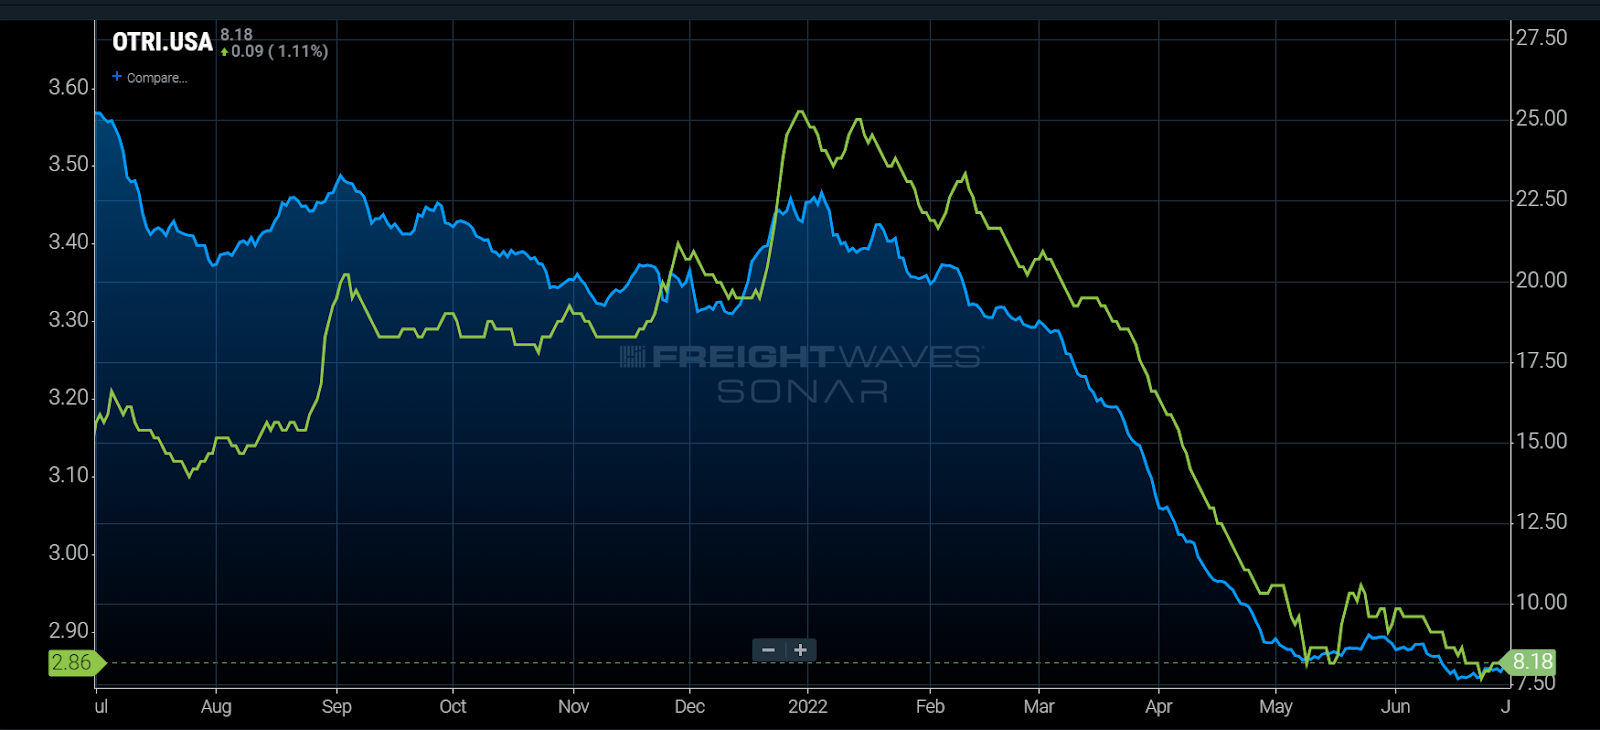
Chart of the Week: Outbound Tender Reject Index, National Trucking Index – USA SONAR: OTRI.USA, NTI.USA
The seasonal rise of truckload spot (NTI) and rejection rates (OTRI) heading into the Fourth of July holiday has occurred every year since 2018 when the Outbound Tender Rejection Index (OTRI) was created. As of July 1, spot and rejection rates had barely recovered to where they were in mid-June. This suggests the market may be headed for another sharp descent this month, but is it?
Spot and tender rejection rate movements are the best measures of near-term truckload capacity changes. Tender rejection rates measure carriers’ ability and willingness to cover contracted load requests from their existing customers. A value of 20% means carriers are rejecting one out of every five loads from their customers. These values are biased toward larger fleets and shippers that control the predominance of freight in the U.S.
Truckload spot rates represent a smaller percentage of freight volume, roughly 15% to 25%, but are representative of the immediate market value of truckload capacity and quick to react to changes in the market.
Lack of seasonal patterns
Over the past two years, seasonal patterns have been largely absent from these numbers as behavioral patterns have changed from consumers all the way up to large companies. Shipping patterns were simply to order as much as you can when you can to make sure companies had inventory for the onslaught of demand.
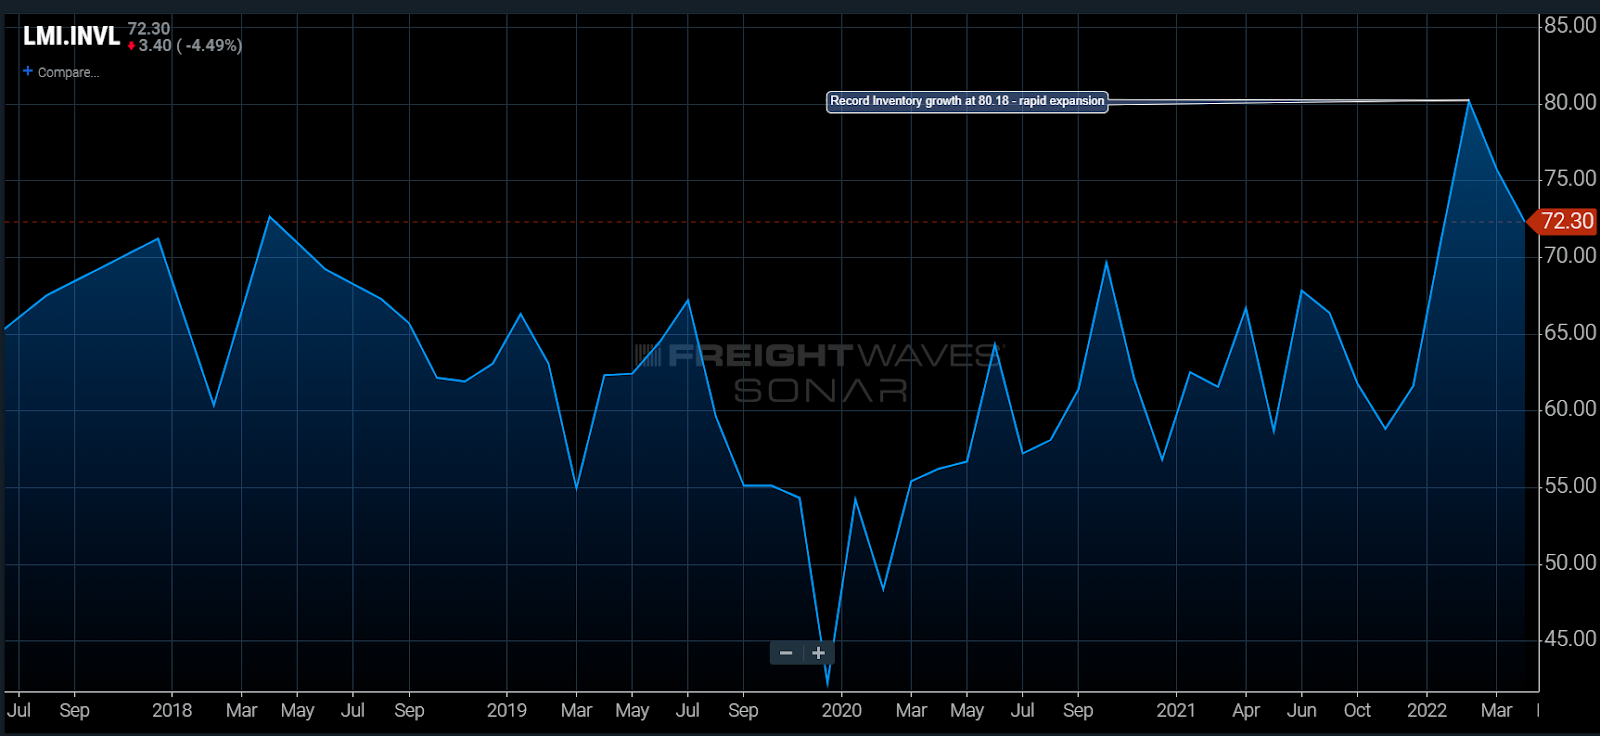
With inventory growth rising again, many companies are transitioning back to a less aggressive ordering strategy, allowing for some slack to form in the truckload sector. The severe decline of both spot and tender rejection rates in March and April — a very unseasonal pattern — provides evidence of this.
The OTRI averaged above 20% from August 2020 through February 2022. National rejection rates fell at their fastest pace this year from 18.46% on March 6 to 8.8% on April 28, signaling a significant easing in the truckload market.
The NTI had been in a slow decline until March 24, averaging losing about a third of a cent per day from early January to the end of March. It accelerated its descent to losing a penny per mile per day from March 24 to April 27. There has been little movement in either the OTRI or NTI since.
Traditionally, both the OTRI and NTI move higher from April to July. Outside of a slight bump in both around Memorial Day, this has not been the case.
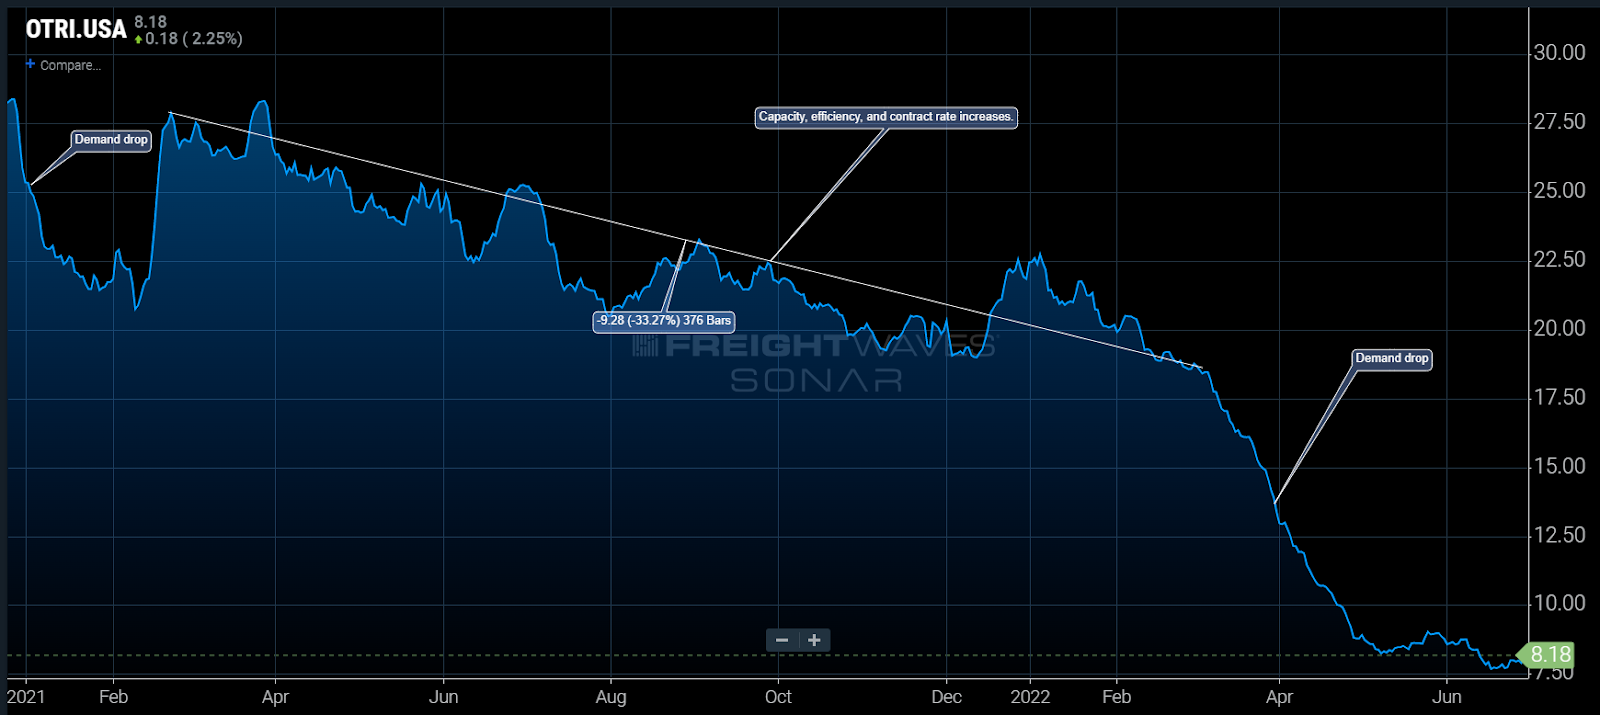
It is safe to say demand erosion has driven the rate of deterioration in the truckload spot market. Capacity growth is slow and does not show up all at once. OTRI’s slow decline from March 2021 to March of 2022 was more indicative of supply side improvement with the severe drops in January of 2021 and March of 2022 being demand driven.
While inventories are growing, supply chain issues remain abundant. Too much inventory is costly and gets in the way. A lot of the current inventory is a mismatch to the current demand. Now supply chain managers have less space to use and order cycles are much longer than in 2019. This means they have to be more nimble and strategic.
Changing behaviors
A lot of the domestic shipping behavior will be based on inventory management over the next six months, meaning smaller orders with shorter lead times. This environment favors less than truckload and expedited, with the rest of the trucking sector being maintenance.
Seasonal patterns have not fully returned and there is plenty of inventory to move and sort through. While the sense of urgency will be largely absent, there is little reason to expect another sharp drop in demand over the next month. A deteriorating consumer environment supports long-term deterioration once the supply chain snarls unravel.
About the Chart of the Week
The FreightWaves Chart of the Week is a chart selection from SONAR that provides an interesting data point to describe the state of the freight markets. A chart is chosen from thousands of potential charts on SONAR to help participants visualize the freight market in real time. Each week a Market Expert will post a chart, along with commentary, live on the front page. After that, the Chart of the Week will be archived on FreightWaves.com for future reference.
SONAR aggregates data from hundreds of sources, presenting the data in charts and maps and providing commentary on what freight market experts want to know about the industry in real time.
The FreightWaves data science and product teams are releasing new datasets each week and enhancing the client experience.
To request a SONAR demo, click here.
Brokerage Compliance Symposium
The day before F3. Every compliance issue you face - fraud exposure, carrier liability, FMCSA rules, cargo theft, insurance gaps - navigated by attorneys and operators defining best practices in a changing industry.
F3 Awards Dinner
The night before F3. FreightTech100 companies honored. FreightTech 25 and Shipper of Choice winners revealed live. Cocktail reception into dinner and live music - 300 industry leaders in one purpose-built room.
F3: Future of Freight Festival
Industry-defining keynotes, rapid-fire technology demos, and industry leaders networking in experiences across Chattanooga - plus the inaugural F3 Awards Dinner featuring the FreightTech and Shipper of Choice reveals.
The day before F3. Every compliance issue you face - fraud exposure, carrier liability, FMCSA rules, cargo theft, insurance gaps - navigated by attorneys and operators defining best practices in a changing industry.
The Signal at Chattanooga Choo Choo • Chattanooga, TN Register NowThe night before F3. FreightTech100 companies honored. FreightTech 25 and Shipper of Choice winners revealed live. Cocktail reception into dinner and live music - 300 industry leaders in one purpose-built room.
The Signal at Chattanooga Choo Choo • Chattanooga, TN Register NowIndustry-defining keynotes, rapid-fire technology demos, and industry leaders networking in experiences across Chattanooga - plus the inaugural F3 Awards Dinner featuring the FreightTech and Shipper of Choice reveals.
The Signal at Chattanooga Choo Choo • Chattanooga, TN Register Now