Chart of the Week: National Truckload Index Linehaul Only, Outbound Tender Rejection Index – USA SONAR: NTIL.USA, OTRI.USA
The average dry van truckload spot rate excluding the estimated cost of fuel (NTIL) has increased 4.2% since the end of April, while carrier contracted load rejection rates are still near all-time lows. While overall capacity is still extremely loose, some areas of the country have seen increasing spot rates and underlying freight flows continue to shift.
The NTIL bounced off a value of $1.50 in early May, rising to a current value of $1.64, with FreightWaves’ forecast value showing upward pressure heading toward the Fourth of July. The national Outbound Tender Rejection Index (OTRI) has bounced between 2.5% and 3.2% during that same time, which does not seem to support the spot rate movement.
It is not the first time that the spot market has seemingly become disconnected from the contract market, but has it really?
Rates are noisy
The first component as to why rejection and spot rates moved in a different direction is the simple fact rates are measuring more than capacity availability. Carrier costs are the largest component of rates most of the time, but these are relatively static and do not contribute much to rate volatility.
Market sentiment is the most volatile and also the most difficult component of spot rates to quantify. This is based on how strongly a shipper needs to move a load and perceived carrier availability. Neither of these items are objective, which is why the market can be irrational in times of transition. This is an oversimplification for certain, but one could write an entire dissertation on market pricing dynamics.
Freight flow is unbalanced
The cost of positioning a truck is also included in many rates, especially in lanes where the destination is oversupplied with capacity. Some amount of this is relatively static based on the natural flow of freight in the U.S. being relatively consistent over time, but that appears to have changed. An aggregate shift in this component can trigger a change in market sentiment.
The Phoenix market is a good example of where there has been significant outbound demand growth relative to inbound. Outbound tender volumes (shipper requests for capacity) are averaging 4% higher year over year over the past month, while inbound tender volumes are down 14%.
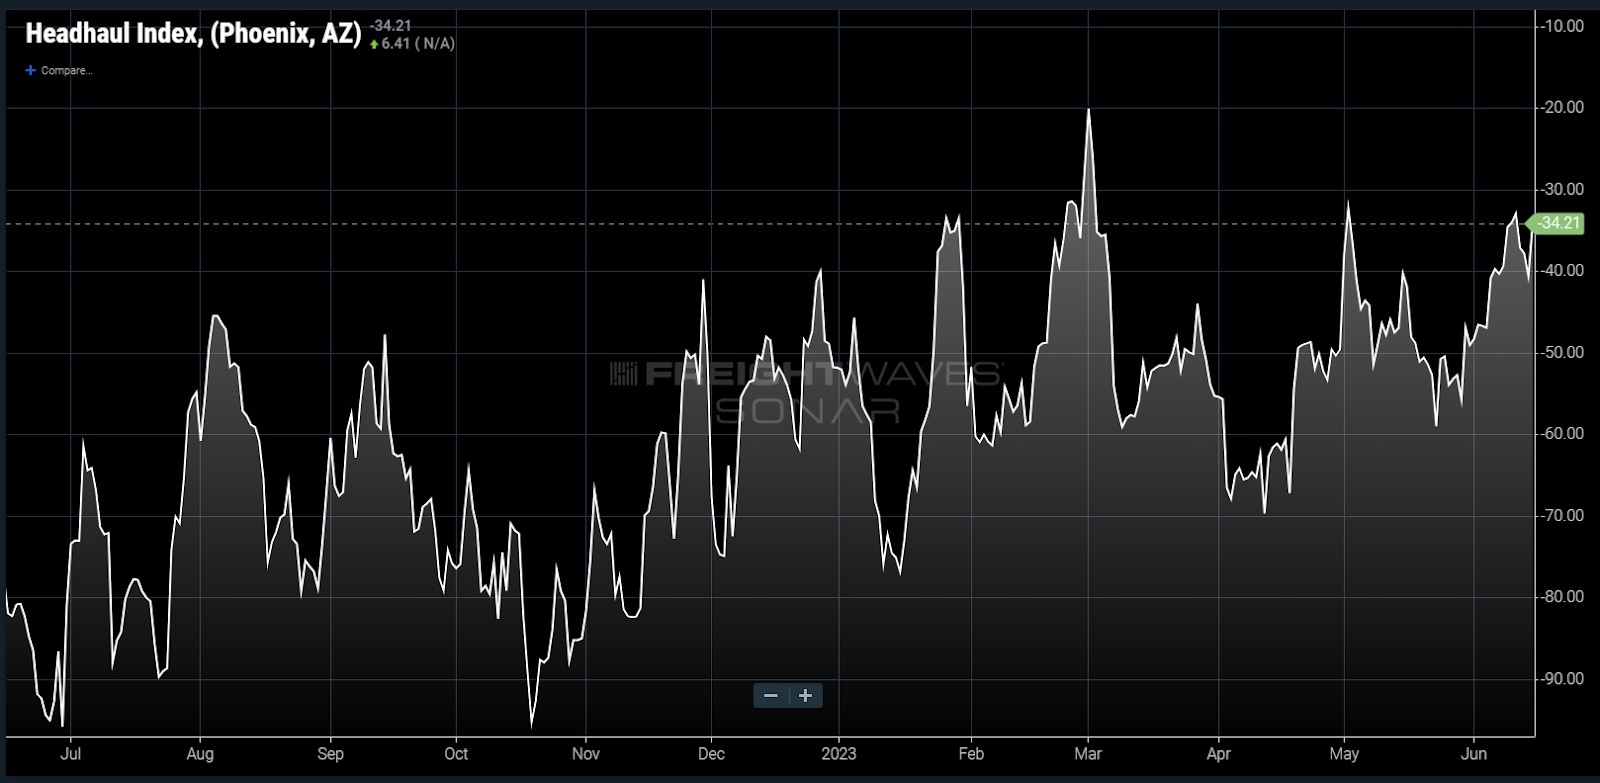
The FreightWaves Headhaul Index (HAUL) measures outbound less inbound tender volumes at a market level and shows Phoenix moving from an extremely inbound-heavy market to much less of one over the past year. Negative values indicate more inbound than outbound.
The fact that this trend did not occur overnight makes it relatively difficult to see. Smaller operators have less visibility of general market trends and so they typically are later to make adjustments. This could be a reason spot rates have been on the rise out of Phoenix, while tender rejections have only increased marginally.
Contract is still king
Perhaps the strongest reasoning behind the apparent discrepancy between tender rejections and spot rate is the fact that contract rates are still averaging well above spot.
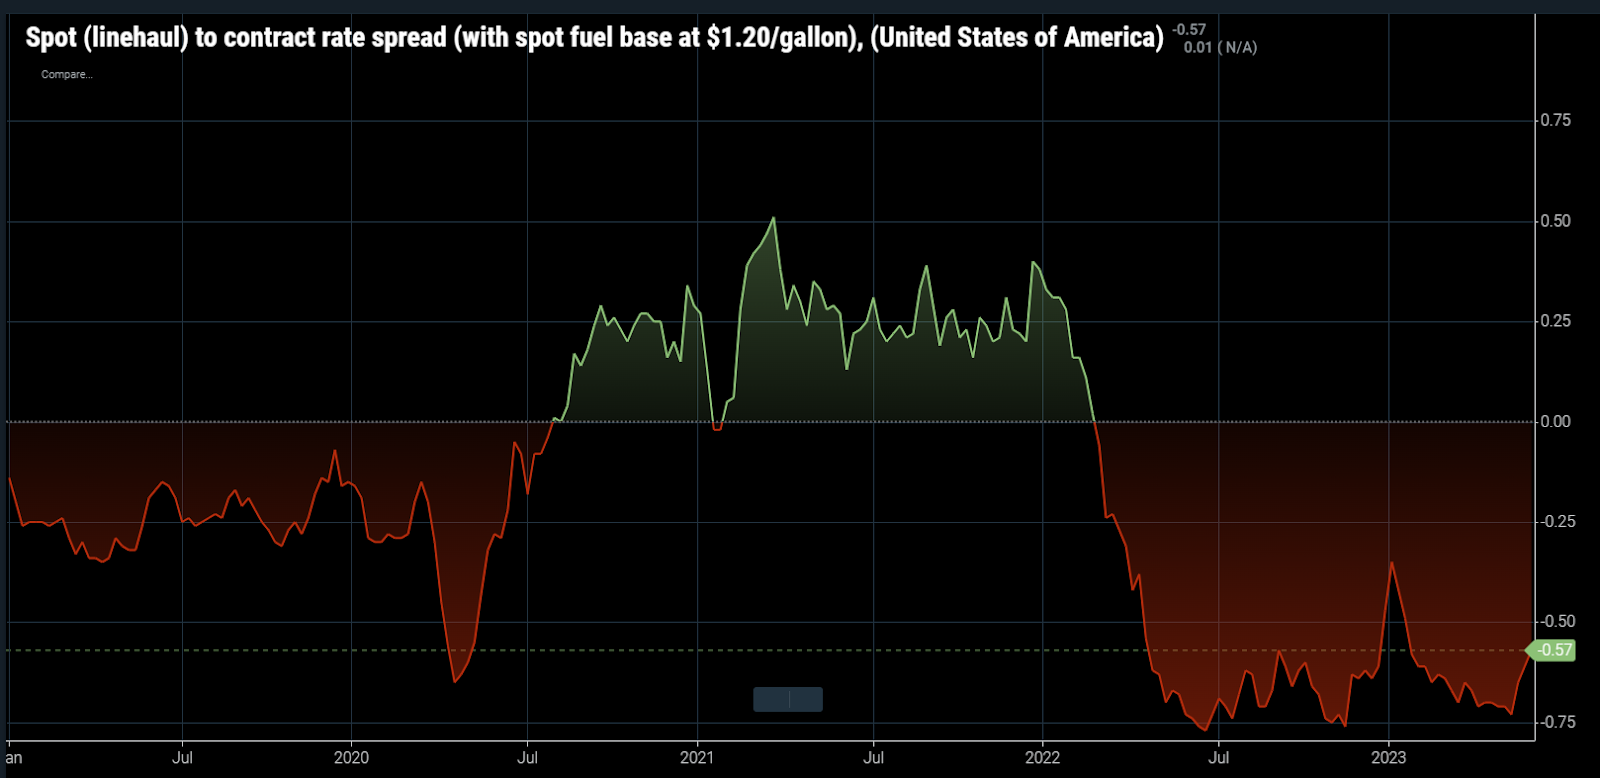
Spot rates excluding an estimated cost of fuel above $1.20 per gallon (in order to make them comparable to contract rates less a standard fuel surcharge) are still showing a deep discount compared to contract rates. The red lines on the chart show periods where the national average spot rate is below contract.
Contract rates move much slower than spot rates due to the nature of their long-term agreements. Their continued elevation relative to spot means that rising spot rates are not going to tempt carriers to divert capacity to the spot market in order to chase higher margins.
While this may not be the inflection point many transportation providers are hoping for in terms of a market shifting to a more balanced state between demand and supply of capacity, it is an indication that the spot market may become more reactive as capacity corrects throughout the rest of the year.
The lack of rise in rejection is also a sign that the perceived market instability will be short lived as carriers recognize and shift capacity where it is needed.
About the Chart of the Week
The FreightWaves Chart of the Week is a chart selection from SONAR that provides an interesting data point to describe the state of the freight markets. A chart is chosen from thousands of potential charts on SONAR to help participants visualize the freight market in real time. Each week a Market Expert will post a chart, along with commentary, live on the front page. After that, the Chart of the Week will be archived on FreightWaves.com for future reference.
SONAR aggregates data from hundreds of sources, presenting the data in charts and maps and providing commentary on what freight market experts want to know about the industry in real time.
The FreightWaves data science and product teams are releasing new datasets each week and enhancing the client experience.
To request a SONAR demo, click here.
Brokerage Compliance Symposium
The day before F3. Every compliance issue you face - fraud exposure, carrier liability, FMCSA rules, cargo theft, insurance gaps - navigated by attorneys and operators defining best practices in a changing industry.
F3 Awards Dinner
The night before F3. FreightTech100 companies honored. FreightTech 25 and Shipper of Choice winners revealed live. Cocktail reception into dinner and live music - 300 industry leaders in one purpose-built room.
F3: Future of Freight Festival
Industry-defining keynotes, rapid-fire technology demos, and industry leaders networking in experiences across Chattanooga - plus the inaugural F3 Awards Dinner featuring the FreightTech and Shipper of Choice reveals.
The day before F3. Every compliance issue you face - fraud exposure, carrier liability, FMCSA rules, cargo theft, insurance gaps - navigated by attorneys and operators defining best practices in a changing industry.
The Signal at Chattanooga Choo Choo • Chattanooga, TN Register NowThe night before F3. FreightTech100 companies honored. FreightTech 25 and Shipper of Choice winners revealed live. Cocktail reception into dinner and live music - 300 industry leaders in one purpose-built room.
The Signal at Chattanooga Choo Choo • Chattanooga, TN Register NowIndustry-defining keynotes, rapid-fire technology demos, and industry leaders networking in experiences across Chattanooga - plus the inaugural F3 Awards Dinner featuring the FreightTech and Shipper of Choice reveals.
The Signal at Chattanooga Choo Choo • Chattanooga, TN Register Now