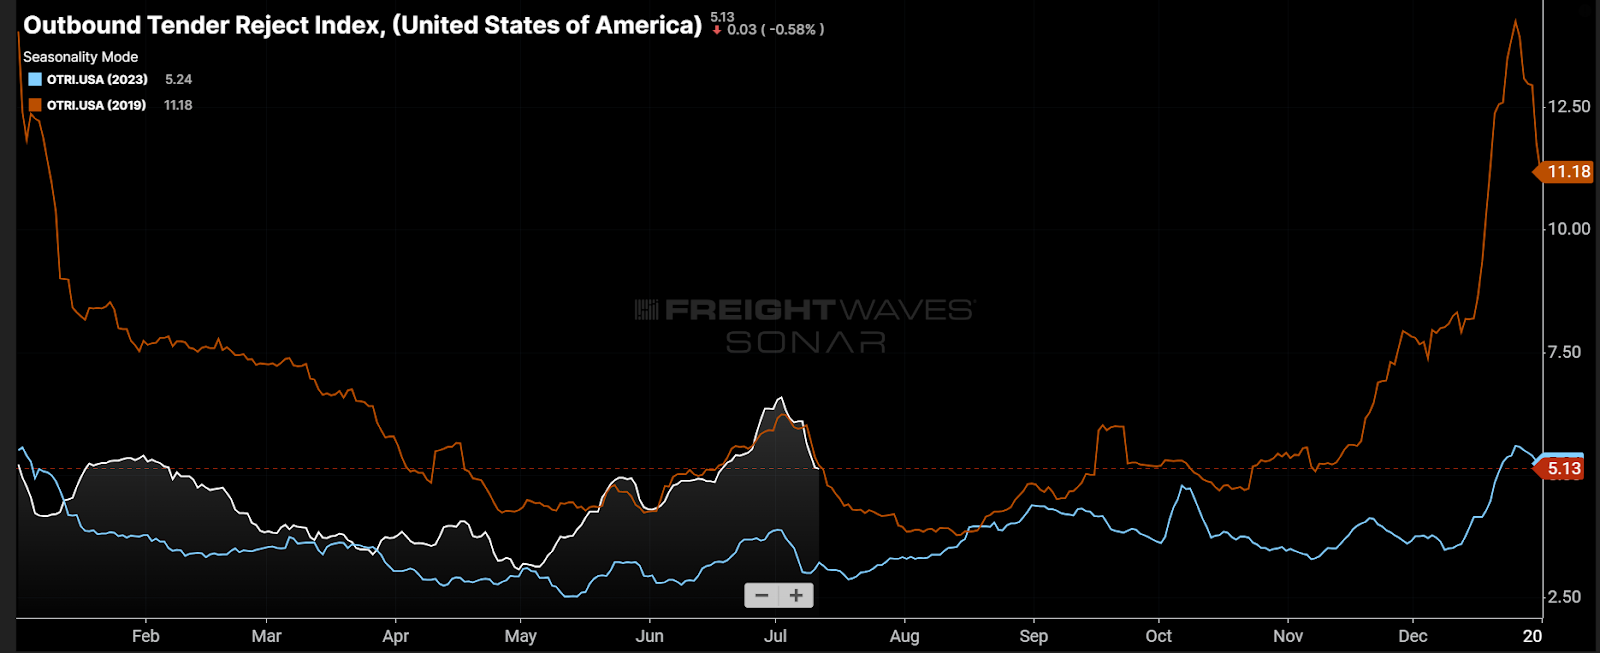
Chart of the Week: Outbound Tender Reject Index – USA SONAR: OTRI.USA
The national Outbound Tender Reject Index topped out at its highest level in nearly two years just before the Fourth of July, a smidge above 6.5%. The more interesting pattern might be the fact that the OTRI has been perfectly mirroring the 2019 pattern since mid-May. Is the 2019 market a good blueprint for the rest of 2024?
What’s similar
The 2019 freight market was extraordinarily loose and characterized by deflating rates and a strong capacity bleed-off. The environment was a product of an overstimulated transportation economy with a prolonged period of tightness and inflating rates in the prior period. This is also true of the 2024 market.
While demand tends to get the credit or blame (depending on your perspective) for market cycle shifts, it was the dramatic growth in supply that was largely responsible for the collapse of the freight economy in late 2018 through 2019.
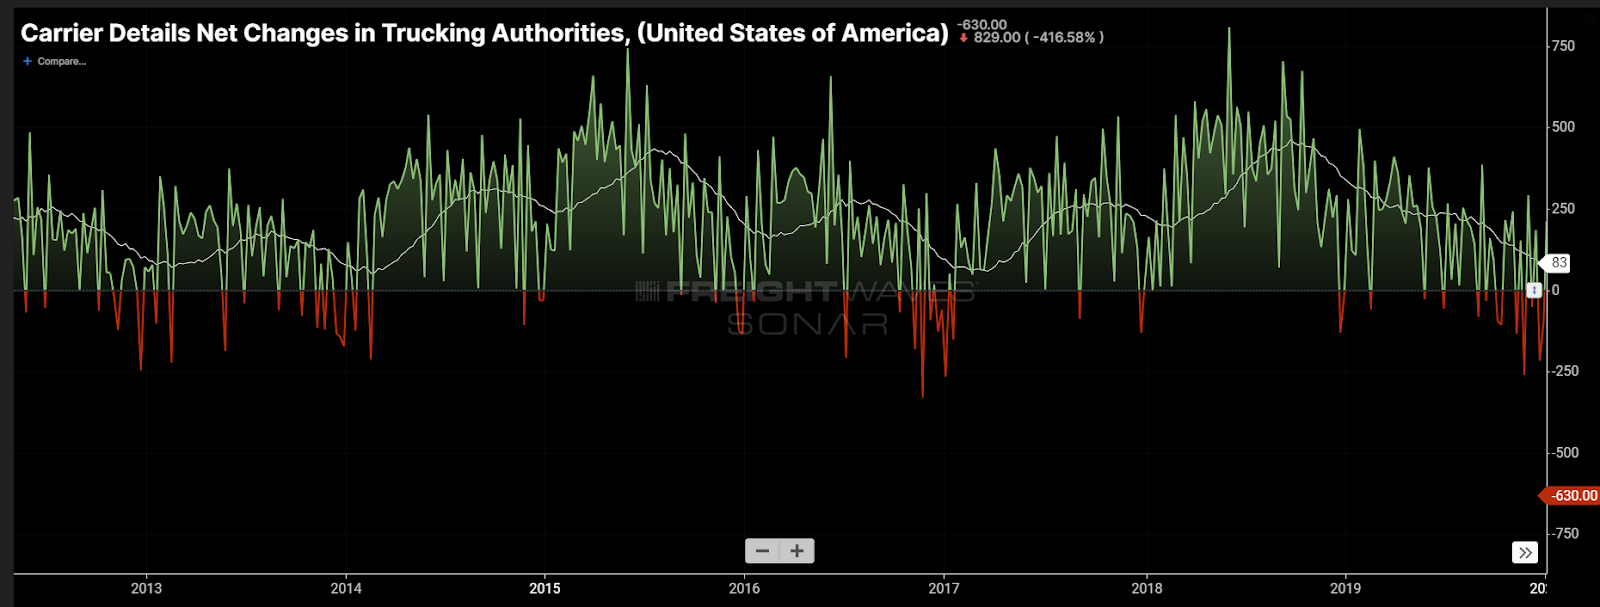
Looking at Carrier Details Net Changes in Trucking Authorities, which measures weekly changes in active motor carrier of property authorities held by the FMCSA, each freight market downturn was preceded by a period of strong growth in new authorities. For example, 2018 had more new operating authorities than any of the previous 10 years.
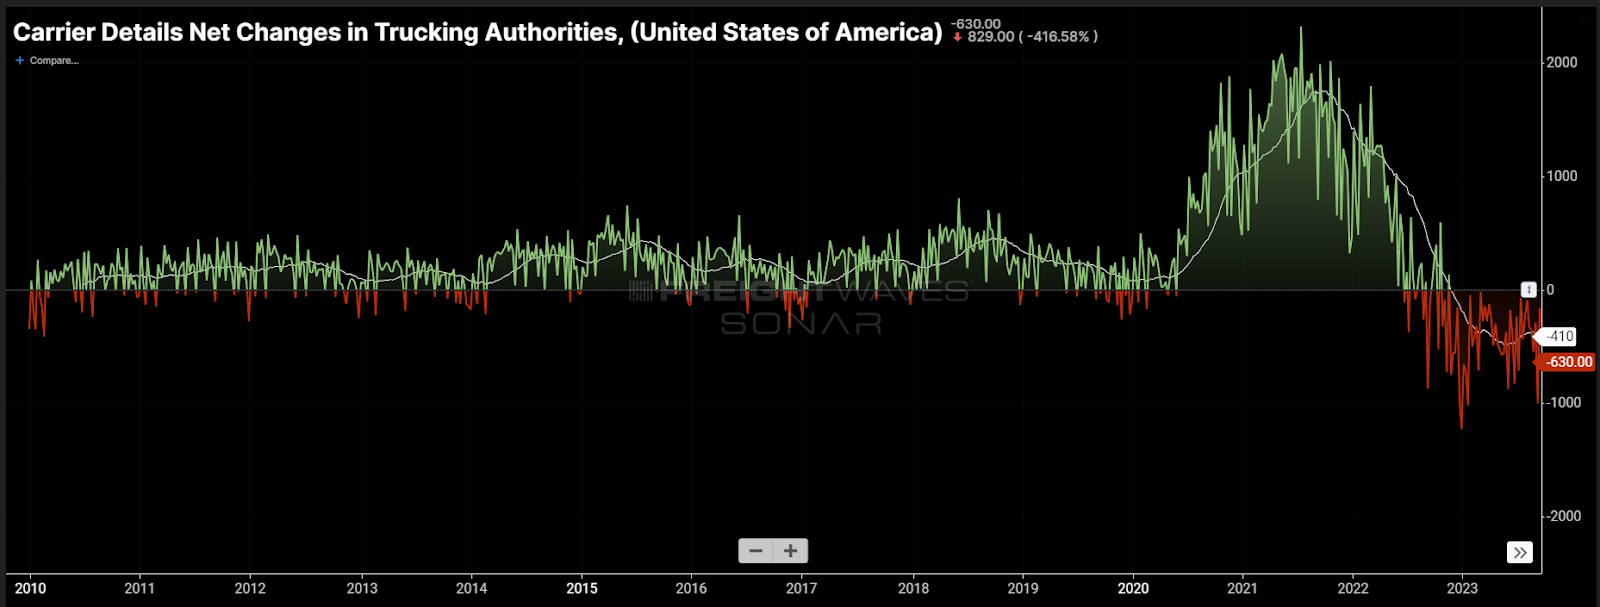
Adding the pandemic-era data to the charts makes the 2018 authority growth look like a non-event. The level of growth in capacity was completely unprecedented.
Fork in the road
The 2019 and 2024 markets are fundamentally the same in the sense that both were extremely soft markets created by overstimulated economies, but the scale of the (post)pandemic era volatility dwarfs any environment preceding it. Hence, anyone looking to apply history forward should be cautious in doing so.
Applying the 2019 OTRI to the rest of 2024 as a tenuous playbook is probably the best way to prepare for the rest of the year in transportation. There are pitfalls to watch out for, however.
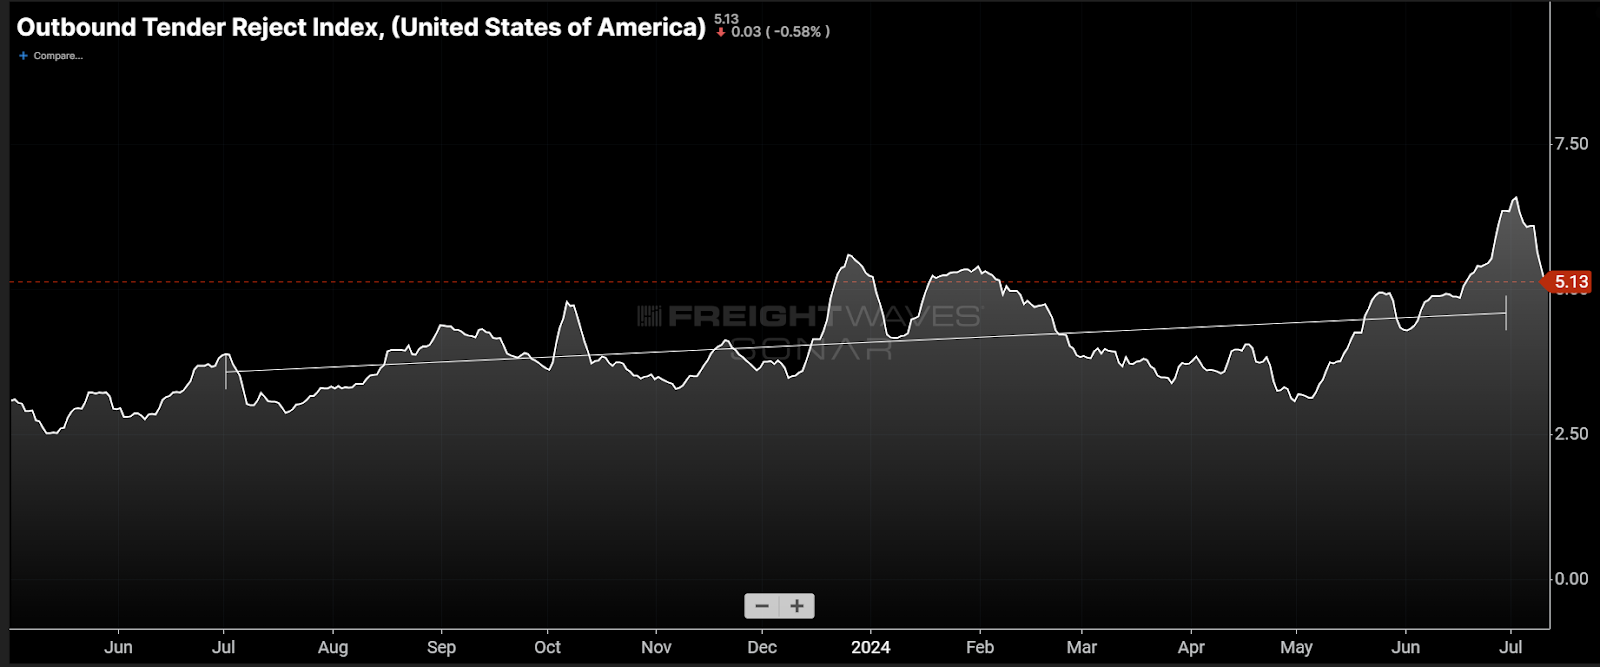
A 6.5% rejection rate is still relatively low from a historic perspective on the Fourth of July, but it is much higher than the 2023 value, which was below 4%. The year-over-year increase suggests that the market is tightening but at a relatively slow linear pace. The risk for acceleration in capacity exits and surging rejection rates is increasing.
Last week, FreightWaves’ John Paul Hampstead reported that there was a large number of carriers who received small-business loans during the pandemic that would have enabled them to operate through an economic downturn, keeping capacity online longer than expected. This is certainly a nuance that was not present in the 2019 market.
The momentum of capacity exiting the market is much stronger than in 2019 and could push supply below the demand curve before participants realize.
Exogenous risks (look it up, it’s a great word)
The bulk of hurricane season is still in front of us. Hurricanes can shutter shipping networks, as Harvey did in September 2017. The market can probably handle a mild event without issue at this point, but as capacity leaves, it becomes only more vulnerable.
The economy can be argued as both a risk and headwind, depending on the policy. The monthly Consumer Price Index fell for the first time in four years, which helps support the argument for the Fed to cut interest rates. This would be a stimulus to the economy.
If the Fed holds rates higher, this will continue to slow the economy and could potentially trigger a recession.
Weather and economic policy are largely outside of anyone’s control, but these should be things that are monitored with a lazy eye for forecasting purposes. At a bare minimum, the 2019 OTRI spiked to 14.5% around the holiday season, indicating that capacity was much more challenging to source in the last two months of the year without any hurricanes or economic-policy changes. Capacity being more challenging to source in the fourth quarter is almost a given.
About the Chart of the Week
The FreightWaves Chart of the Week is a chart selection from SONAR that provides an interesting data point to describe the state of the freight markets. A chart is chosen from thousands of potential charts on SONAR to help participants visualize the freight market in real time. Each week a Market Expert will post a chart, along with commentary, live on the front page. After that, the Chart of the Week will be archived on FreightWaves.com for future reference.
SONAR aggregates data from hundreds of sources, presenting the data in charts and maps and providing commentary on what freight market experts want to know about the industry in real time.
The FreightWaves data science and product teams are releasing new datasets each week and enhancing the client experience.
To request a SONAR demo, click here.
Brokerage Compliance Symposium
The day before F3. Every compliance issue you face - fraud exposure, carrier liability, FMCSA rules, cargo theft, insurance gaps - navigated by attorneys and operators defining best practices in a changing industry.
F3 Awards Dinner
The night before F3. FreightTech100 companies honored. FreightTech 25 and Shipper of Choice winners revealed live. Cocktail reception into dinner and live music - 300 industry leaders in one purpose-built room.
F3: Future of Freight Festival
Industry-defining keynotes, rapid-fire technology demos, and industry leaders networking in experiences across Chattanooga - plus the inaugural F3 Awards Dinner featuring the FreightTech and Shipper of Choice reveals.
The day before F3. Every compliance issue you face - fraud exposure, carrier liability, FMCSA rules, cargo theft, insurance gaps - navigated by attorneys and operators defining best practices in a changing industry.
The Signal at Chattanooga Choo Choo • Chattanooga, TN Register NowThe night before F3. FreightTech100 companies honored. FreightTech 25 and Shipper of Choice winners revealed live. Cocktail reception into dinner and live music - 300 industry leaders in one purpose-built room.
The Signal at Chattanooga Choo Choo • Chattanooga, TN Register NowIndustry-defining keynotes, rapid-fire technology demos, and industry leaders networking in experiences across Chattanooga - plus the inaugural F3 Awards Dinner featuring the FreightTech and Shipper of Choice reveals.
The Signal at Chattanooga Choo Choo • Chattanooga, TN Register Now