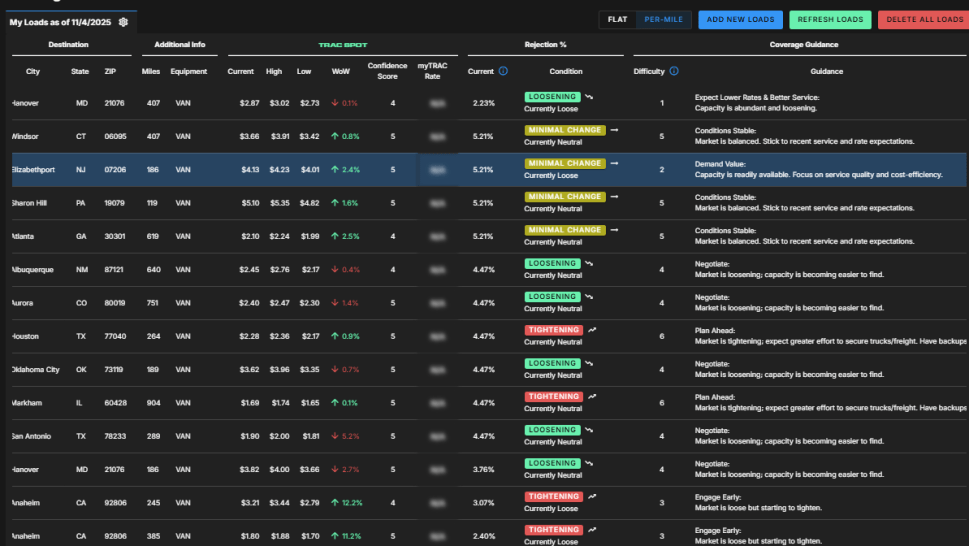
The SONAR platform offers numerous applications and abundant data to help brokers stay ahead in the increasingly volatile truckload market. Unique datasets—such as tender rejections and volumes—help users recognize when the market is shifting and understand the depth of its impact beyond transactional activity. SONAR also provides robust spot and contract rate data derived from its Trusted Rate Assessment Consortium (TRAC) of brokers and invoice data from Cass.
Users can explore SONAR the traditional way by entering their own tickers into a custom dashboard or take advantage of the preconfigured dashboards already available within the platform. One of SONAR’s greatest strengths is the breadth and depth of its diverse datasets, and dashboards are an excellent way to get an introduction to, and summary of, what’s available.
Step 1: Dashboards and data
The Truckload National Insights page is an ideal starting point for brokers looking to identify where their attention is most needed. This page provides a quick yet detailed overview of what SONAR’s datasets reveal about the domestic truckload market.
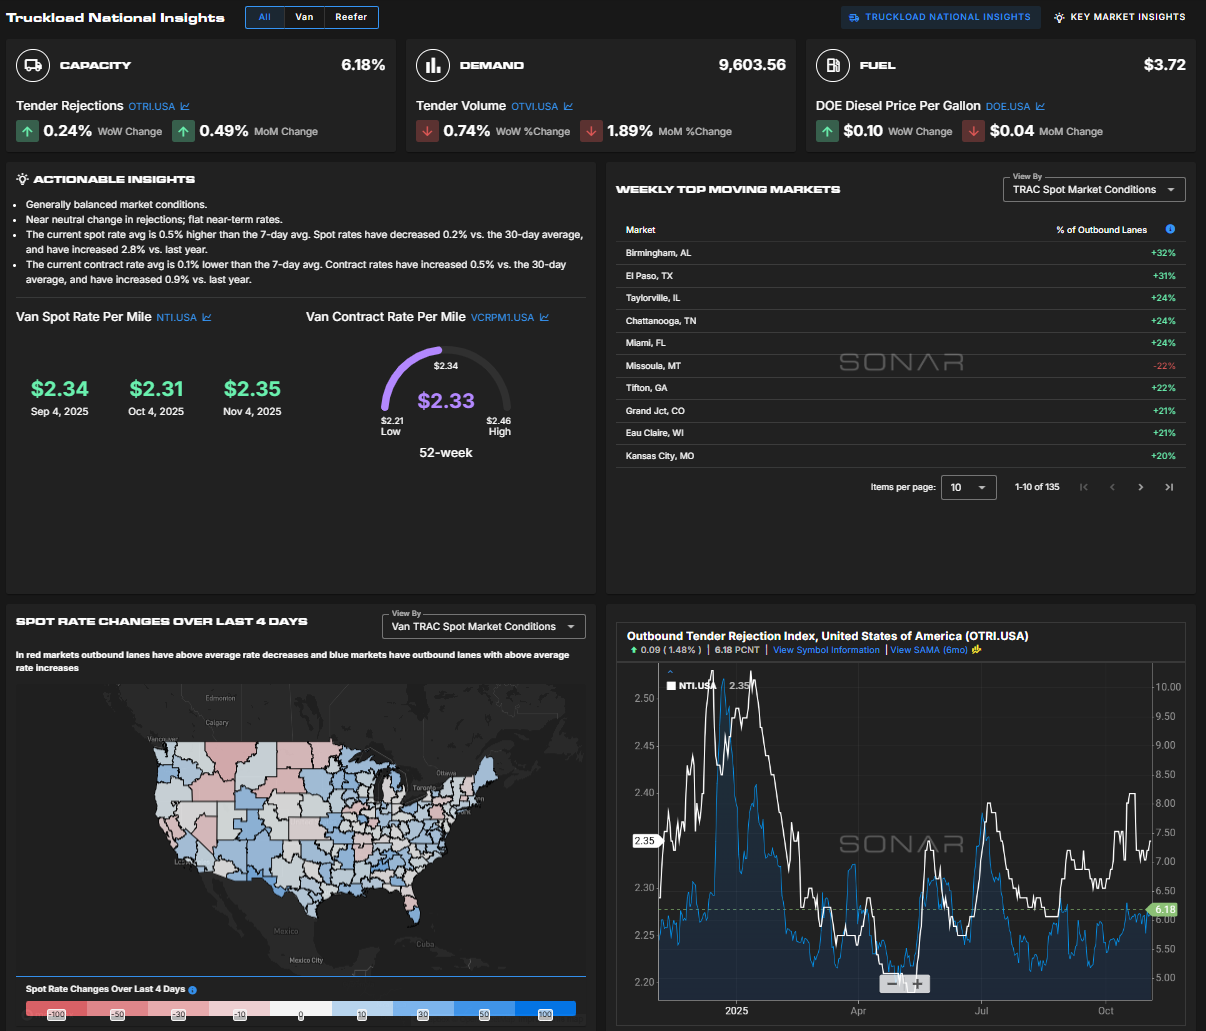
Capacity and demand indicators—based on tender data—are positioned at the top of the page to highlight any high-level shifts signaling significant market events. Directly below these indicators is a bulleted summary of actionable insights, which summarizes market conditions and highlights areas that require the most attention.
National spot and contract rate indicators sit below the insights section, providing a clear view of short- and long-term rate trends. Next to these sections is a list of the top 10 markets where volume or spot rates have changed the most over the past week.

Clicking on any market in this list takes you to the Key Market Insights page, where you can examine origin market conditions in greater detail.
At the bottom of the page, you’ll find a heat map showing significant spot rate changes by market. You can toggle between various indicators and review a chart of the National Truckload Index (NTI) and Outbound Tender Rejection Index (OTRI) to quickly identify emerging trends.
Step 2: Rates and negotiating
Once you’ve reviewed the high-level market overview and identified where to focus—or if you’re ready to start quoting and covering loads—the Broker Tool Kit is your next stop.
The Broker Tool Kit includes three primary applications:
- 1. Rate Intelligence (and Batch Rate Intelligence)
- 2. Coverage Guide
- 3. Sales Guide
Each tool is designed for a specific brokerage function:
- –Rate Intelligence tools support brokers quoting both spot and long-term managed freight.
- –Coverage Guide focuses on lane prioritization and quote speed.
- –Sales Guide identifies where the greatest opportunities exist across the U.S. for targeting new customers.
Rate Intelligence
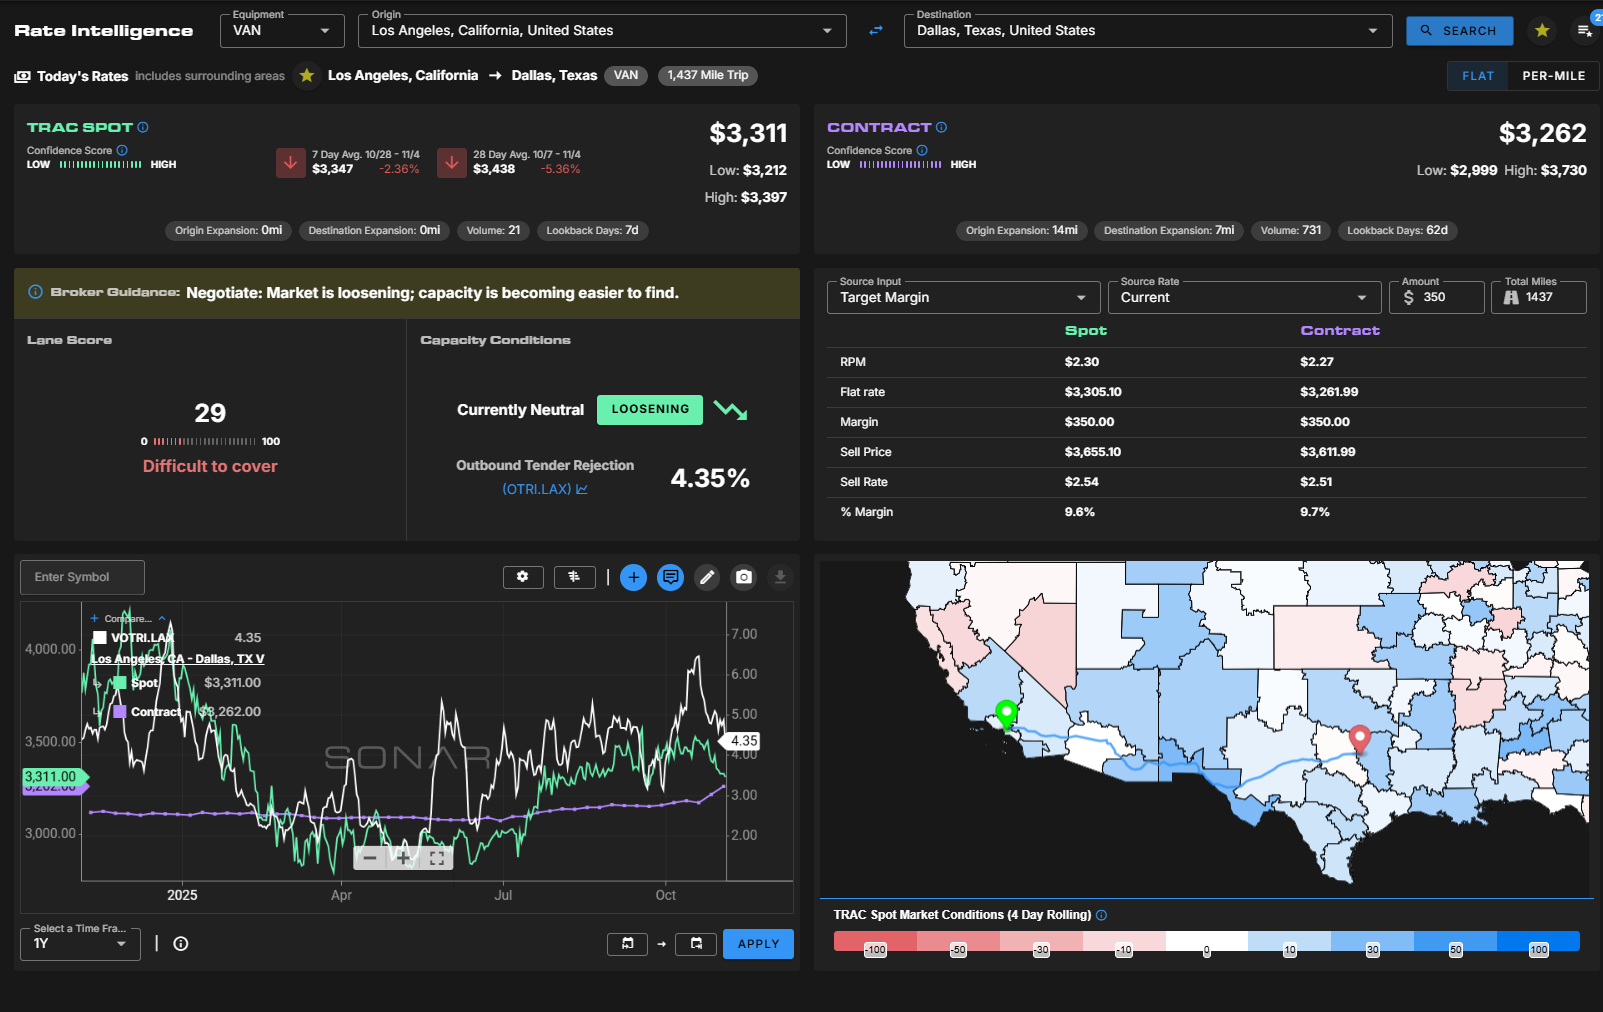
Rate Intelligence allows users to input any origin–destination pair to view both spot (buy-side) and contract rates, along with a wealth of contextual data. Each rate includes confidence scores and other metadata to indicate the density and reliability of the data.
Like financial markets, not every lane has enough activity to be considered dependable. SONAR infers rates from nearby markets when data diversity is insufficient, adhering to the 5/25 rule—a minimum of five contributors per lane, with no single contributor accounting for more than 25% of the rate’s weight.
Broker Guidance translates underlying data into actionable insights. Lane scores indicate how difficult a lane may be to cover based on freight imbalances between origin and destination markets. For example, an outbound-heavy lane moving into an inbound-heavy market will have a lower lane score, signaling a higher degree of sourcing difficulty.

Batch Rate Intelligence is ideal for brokers handling multiple lanes for a bid. After uploading a list of lanes, users can download a sheet containing spot and contract rates, along with contextual data optimized for long-term pricing.
Coverage Guide
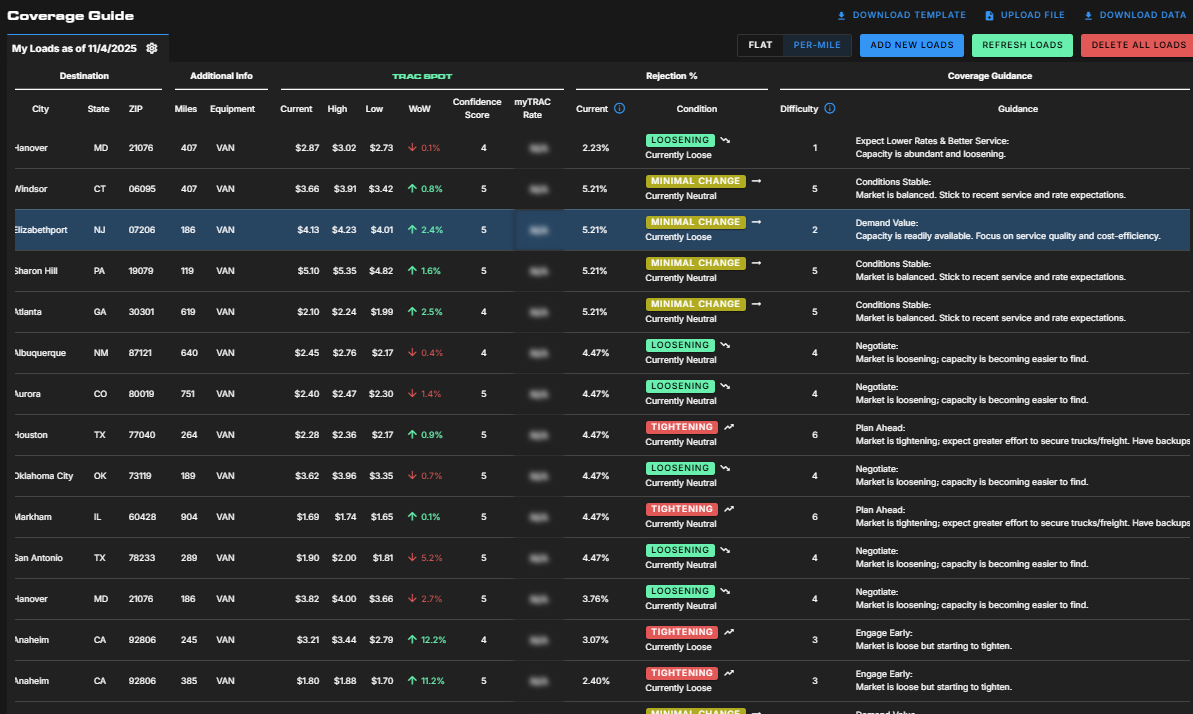
The Coverage Guide is a procurement tool designed to help brokers quickly identify which loads need immediate attention and which can wait. Like the Batch Rate Intelligence tool, it provides spot rate data—but it focuses more on short-term market signals, allowing floor brokers to quote more efficiently.
The interface includes a market direction indicator and a sortable difficulty column to prioritize challenging lanes. The Guidance column provides direct pricing and coverage recommendations, eliminating the need for manual data interpretation.
Sales Guide
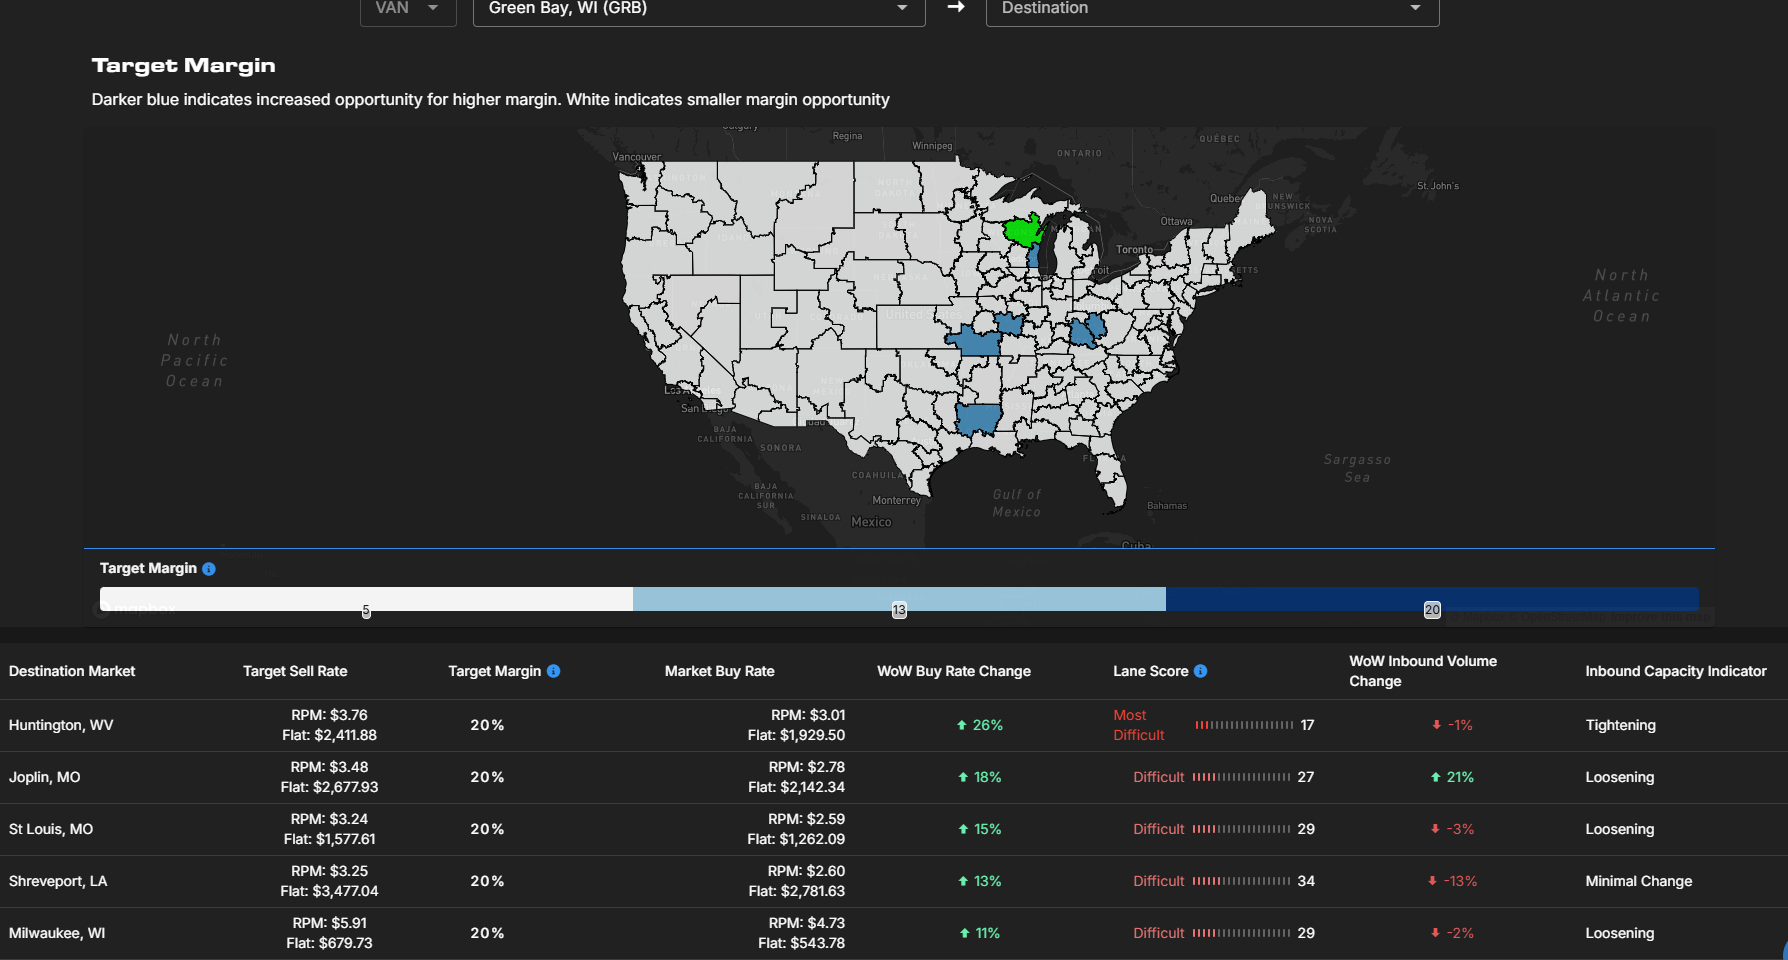
The Sales Guide landing page features a heat map and list of markets experiencing the highest levels of service disruption. Clicking on any market reveals lanes with the greatest margin opportunities, based on disruption levels and lane coverage difficulty.
This tool can also serve as a quick reference for current customers’ markets, helping brokers stay proactive and avoid surprises when covering daily freight.
Brokerage Compliance Symposium
The day before F3. Every compliance issue you face - fraud exposure, carrier liability, FMCSA rules, cargo theft, insurance gaps - navigated by attorneys and operators defining best practices in a changing industry.
F3 Awards Dinner
The night before F3. FreightTech100 companies honored. FreightTech 25 and Shipper of Choice winners revealed live. Cocktail reception into dinner and live music - 300 industry leaders in one purpose-built room.
F3: Future of Freight Festival
Industry-defining keynotes, rapid-fire technology demos, and industry leaders networking in experiences across Chattanooga - plus the inaugural F3 Awards Dinner featuring the FreightTech and Shipper of Choice reveals.
The day before F3. Every compliance issue you face - fraud exposure, carrier liability, FMCSA rules, cargo theft, insurance gaps - navigated by attorneys and operators defining best practices in a changing industry.
The Signal at Chattanooga Choo Choo • Chattanooga, TN Register NowThe night before F3. FreightTech100 companies honored. FreightTech 25 and Shipper of Choice winners revealed live. Cocktail reception into dinner and live music - 300 industry leaders in one purpose-built room.
The Signal at Chattanooga Choo Choo • Chattanooga, TN Register NowIndustry-defining keynotes, rapid-fire technology demos, and industry leaders networking in experiences across Chattanooga - plus the inaugural F3 Awards Dinner featuring the FreightTech and Shipper of Choice reveals.
The Signal at Chattanooga Choo Choo • Chattanooga, TN Register Now