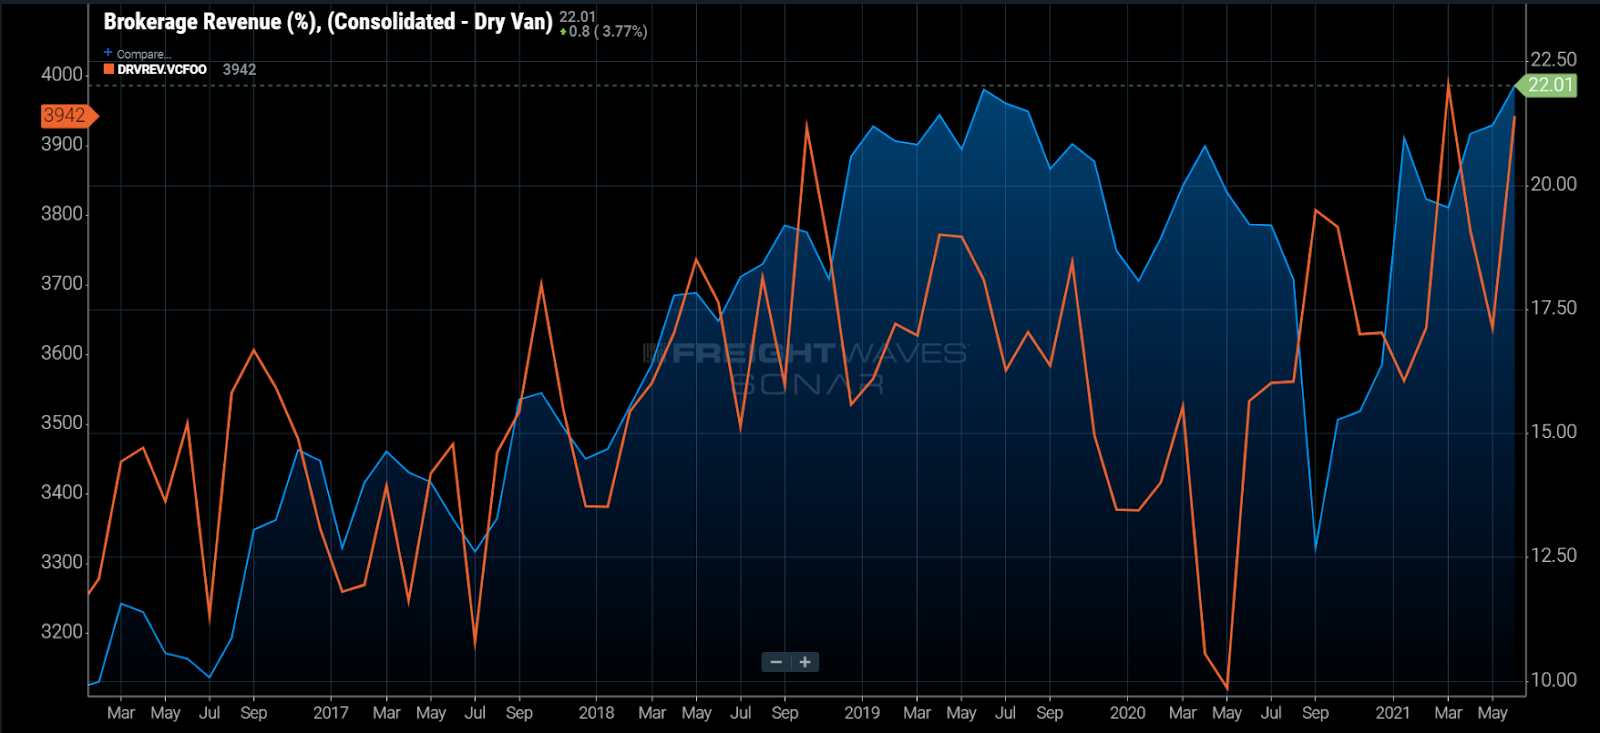
Chart of the Week: Brokerage Revenue as a Percent of Total, Revenue per Driver per Week – Dry Van Consolidated SONAR: BROREV.VCNS, DRVREV.VCFOO
According to Truckload Carriers Association (TCA) data, brokerage revenue as a percent of total hit an all-time high this past June with a value of 22.01%. This is occurring at the same time as near-record revenue efficiency is being hit on the asset side. When these two values move higher together, it is an indication that this is as good as it gets for asset-based carriers.
The TCA data consists of mostly midsize and small carriers, a segment that many feared would not do well during the pandemic era. With transportation capacity at its tightest levels in over a decade, having a truck makes you an invaluable commodity. If you have struggled over the past few months as a carrier, it may be time to make a change.
The reason these two values moving higher together is such a positive sign lies in the fact that asset-based carriers — most of them at least — serve the asset side first. The brokerage arm tends to funnel loads to the core business unit in areas of need. When brokerage and asset revenues are expanding simultaneously, it is an indication that both business units are flourishing.
Looking back at 2019, brokerage revenue percentages remained elevated while revenue per driver declined — an indication that carriers were pricing loads lower to fill the trucks while the brokerage remained active. During slower periods like 2019, brokerage arms offer low- or below-cost rates to shippers on a transactional basis in order to maintain equipment utilization levels and keep trucks moving.
During periods like 2018 and the past few months of 2021, carriers have had more than enough business to keep their trucks moving, which has allowed the brokerage to spend more time doing what a non-asset-based brokerage would do — focus on expanding margins.

Probably the single best value to use to measure carrier effectiveness is the operating ratio (OR), which measures how much profit is made for every dollar spent on moving the freight. A 93% OR indicates the carrier made 7 cents for every dollar spent operationally.
A lower OR is better, with anything over 100% indicating an operating loss — something that has only occurred once over the past year in aggregate during the winter freeze event in February. Trucks were stalled and shippers shuttered operations for about a week in some of the hardest-hit areas. But as you can see, all it really did was defer activity and revenue until March as ORs hit an all-time low for association members.
June’s results were potentially more impressive than March, considering there were no natural disasters fueling demand or deferring revenue recognition. Regardless, carriers are having a banner year. The big questions: When will the cycle end and what does this mean when it does?
It is difficult to predict when this cycle will turn, but looking at this data will give us verification when it does. One big takeaway for the future is that “record” months mean making only a 7% profit for the small and midsize fleets, a paltry value in most other industries. This does not inspire much hope for when the market settles.

Smaller carriers feel the impacts of rising costs more so than large ones, and costs are rising quickly. Equipment is scarce and maintenance costs are skyrocketing because of it. This will have extended downstream effects as carriers will have to play catch-up when equipment becomes available.
The good news for carriers is that this cycle is proving very lucrative and savvy carriers will be preparing for when the market stabilizes. Having information about the market on all levels will be crucial to staying ahead of the curve.
About the Chart of the Week
The FreightWaves Chart of the Week is a chart selection from SONAR that provides an interesting data point to describe the state of the freight markets. A chart is chosen from thousands of potential charts on SONAR to help participants visualize the freight market in real time. Each week a Market Expert will post a chart, along with commentary, live on the front page. After that, the Chart of the Week will be archived on FreightWaves.com for future reference.
SONAR aggregates data from hundreds of sources, presenting the data in charts and maps and providing commentary on what freight market experts want to know about the industry in real time.
The FreightWaves data science and product teams are releasing new data sets each week and enhancing the client experience.
To request a SONAR demo, click here.
Brokerage Compliance Symposium
The day before F3. Every compliance issue you face - fraud exposure, carrier liability, FMCSA rules, cargo theft, insurance gaps - navigated by attorneys and operators defining best practices in a changing industry.
F3 Awards Dinner
The night before F3. FreightTech100 companies honored. FreightTech 25 and Shipper of Choice winners revealed live. Cocktail reception into dinner and live music - 300 industry leaders in one purpose-built room.
F3: Future of Freight Festival
Industry-defining keynotes, rapid-fire technology demos, and industry leaders networking in experiences across Chattanooga - plus the inaugural F3 Awards Dinner featuring the FreightTech and Shipper of Choice reveals.
The day before F3. Every compliance issue you face - fraud exposure, carrier liability, FMCSA rules, cargo theft, insurance gaps - navigated by attorneys and operators defining best practices in a changing industry.
The Signal at Chattanooga Choo Choo • Chattanooga, TN Register NowThe night before F3. FreightTech100 companies honored. FreightTech 25 and Shipper of Choice winners revealed live. Cocktail reception into dinner and live music - 300 industry leaders in one purpose-built room.
The Signal at Chattanooga Choo Choo • Chattanooga, TN Register NowIndustry-defining keynotes, rapid-fire technology demos, and industry leaders networking in experiences across Chattanooga - plus the inaugural F3 Awards Dinner featuring the FreightTech and Shipper of Choice reveals.
The Signal at Chattanooga Choo Choo • Chattanooga, TN Register Now