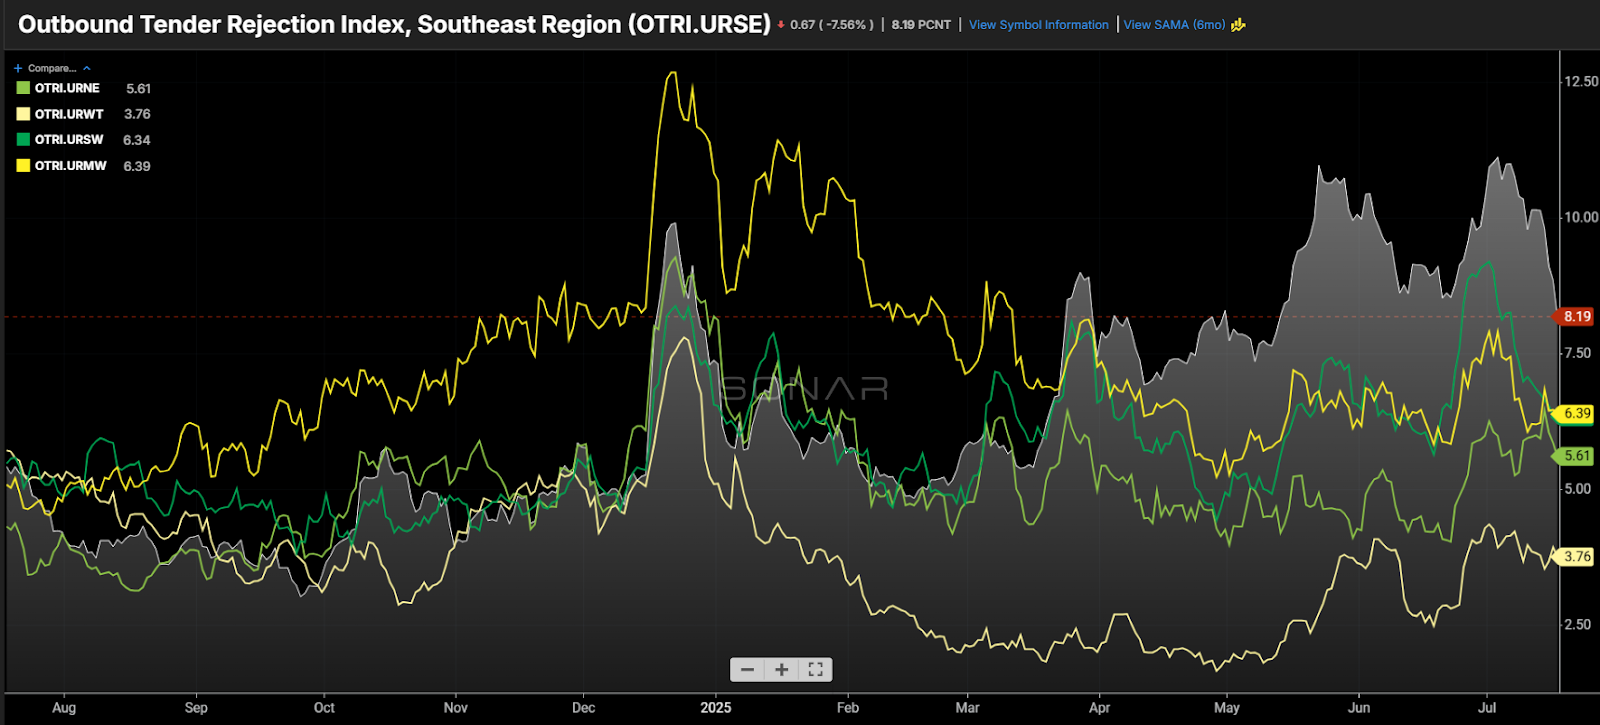
Chart of the Week: Regional Rejection Indexes – Southeast, Midwest, Northeast, West Coast, Southwest SONAR: OTRI.URSE, OTRI.URNE, OTRI.URMW, OTRI.URWT, OTRI.URSW
Truckload tender rejection rates have diverged significantly over the past year, reflecting growing regional imbalances in the U.S. trucking market. In the Southeast, rejection rates have averaged close to 10% over the past two months, while West Coast rates have remained around 3.5%. This widening gap signals increasing network and pricing inefficiencies and suggests that the truckload market is less stable than it appears on the surface.
At this time last year, the gap between the two regions was much narrower: the Southeast averaged around 6%, while the West Coast sat only slightly lower at 5.3%. They’re not alone—other regions have also drifted apart. During the winter, the Midwest saw the most disruption, with rejection rates exceeding 12% for the first time in two years, while the West Coast remained under 8%.
For context, rejection rates above 10% are typically problematic for shippers, often triggering rapid rate inflation. These spikes are usually associated with holiday periods like Christmas and the Fourth of July.
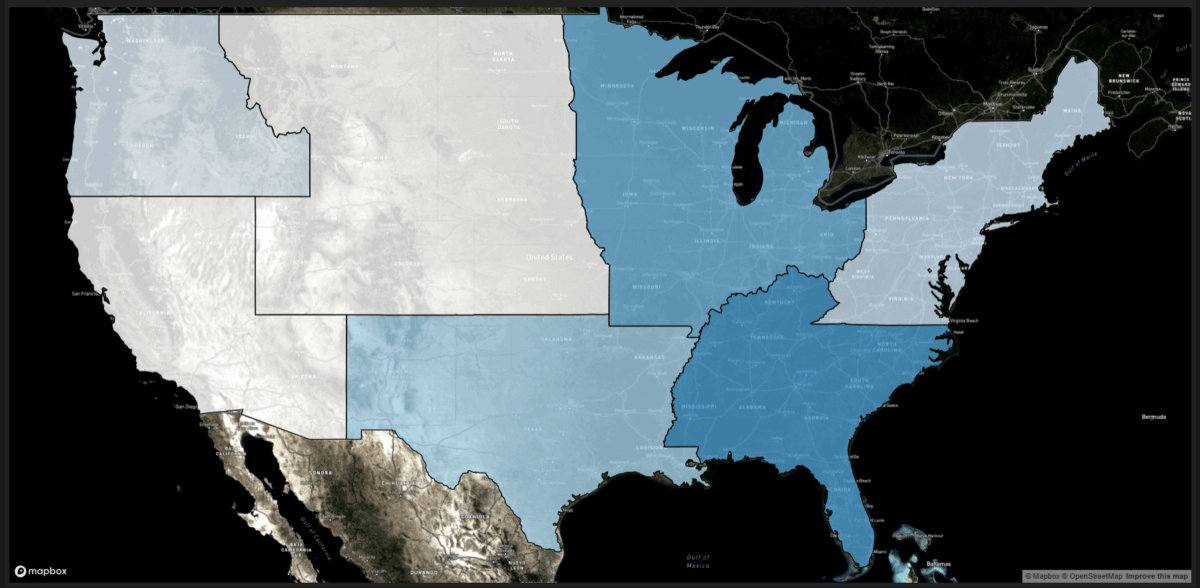
The increasing dispersion in regional rejection rates points to a less balanced freight environment. Carrier networks constantly struggle to keep trucks moving toward areas where equipment is needed. When demand shifts—as it has over the past year—networks are slow to recalibrate.
Not so oversupplied
Following the pandemic, truckload capacity was so abundant that regional imbalances were largely absorbed. Trucks were readily available, often waiting on the sidelines. That’s no longer the case.

Since late 2022, the market has been shedding capacity. According to FMCSA data, more than 48,000 registered operators have exited the market. Net revocations have accelerated since last October, now averaging nearly 200 more per week year-over-year.
Still, the increase in total rejection rates has remained modest—hovering around 6% in recent months—insufficient to spark a significant capacity crunch or a market “flip.”
Rates are also driving regional inequity
One contributor to the growing disparity in rejection rates is the diverging trend in contract rates, particularly out of eastern markets.

According to SONAR’s invoice data, the average contract rate per mile from Los Angeles to Chicago has risen about 3% over the past two years. In contrast, the rate from Atlanta to Chicago has declined nearly 7%. While these are just two lanes among many, they illustrate a broader trend: outbound Southern California rates have shown more upward pressure than those in the East.
Length of haul also plays a role. Freight originating in Atlanta averages about 500 miles, while Los Angeles loads average more than 800 miles. This difference incentivizes carriers to prioritize longer West Coast hauls.

Rejection rates out of Atlanta — the Southeast’s largest market — have spiked in recent months. Although this hasn’t yet driven up contract rates, it has had a strong effect on the spot market. Spot rates in the Atlanta-to-Chicago lane are up 41% since mid-April. If sustained, this could eventually lead to higher contract rates. In the meantime, it highlights how fragile the spot market environment is.
The Bottom Line
The freight market remains relatively soft, with little upward movement in long-term contract rates. But under the surface, conditions are shifting. The fact that spot rates have surged more than 40% in a well-traveled lane — even in a down market — demonstrates just how vulnerable the truckload environment has become.
About the Chart of the Week
The FreightWaves Chart of the Week is a chart selection from SONAR that provides an interesting data point to describe the state of the freight markets. A chart is chosen from thousands of potential charts on SONAR to help participants visualize the freight market in real time. Each week a Market Expert will post a chart, along with commentary, live on the front page. After that, the Chart of the Week will be archived on FreightWaves.com for future reference.
SONAR aggregates data from hundreds of sources, presenting the data in charts and maps and providing commentary on what freight market experts want to know about the industry in real time.
The FreightWaves data science and product teams are releasing new datasets each week and enhancing the client experience.
To request a SONAR demo, click here.
Brokerage Compliance Symposium
The day before F3. Every compliance issue you face - fraud exposure, carrier liability, FMCSA rules, cargo theft, insurance gaps - navigated by attorneys and operators defining best practices in a changing industry.
F3 Awards Dinner
The night before F3. FreightTech100 companies honored. FreightTech 25 and Shipper of Choice winners revealed live. Cocktail reception into dinner and live music - 300 industry leaders in one purpose-built room.
F3: Future of Freight Festival
Industry-defining keynotes, rapid-fire technology demos, and industry leaders networking in experiences across Chattanooga - plus the inaugural F3 Awards Dinner featuring the FreightTech and Shipper of Choice reveals.
The day before F3. Every compliance issue you face - fraud exposure, carrier liability, FMCSA rules, cargo theft, insurance gaps - navigated by attorneys and operators defining best practices in a changing industry.
The Signal at Chattanooga Choo Choo • Chattanooga, TN Register NowThe night before F3. FreightTech100 companies honored. FreightTech 25 and Shipper of Choice winners revealed live. Cocktail reception into dinner and live music - 300 industry leaders in one purpose-built room.
The Signal at Chattanooga Choo Choo • Chattanooga, TN Register NowIndustry-defining keynotes, rapid-fire technology demos, and industry leaders networking in experiences across Chattanooga - plus the inaugural F3 Awards Dinner featuring the FreightTech and Shipper of Choice reveals.
The Signal at Chattanooga Choo Choo • Chattanooga, TN Register Now