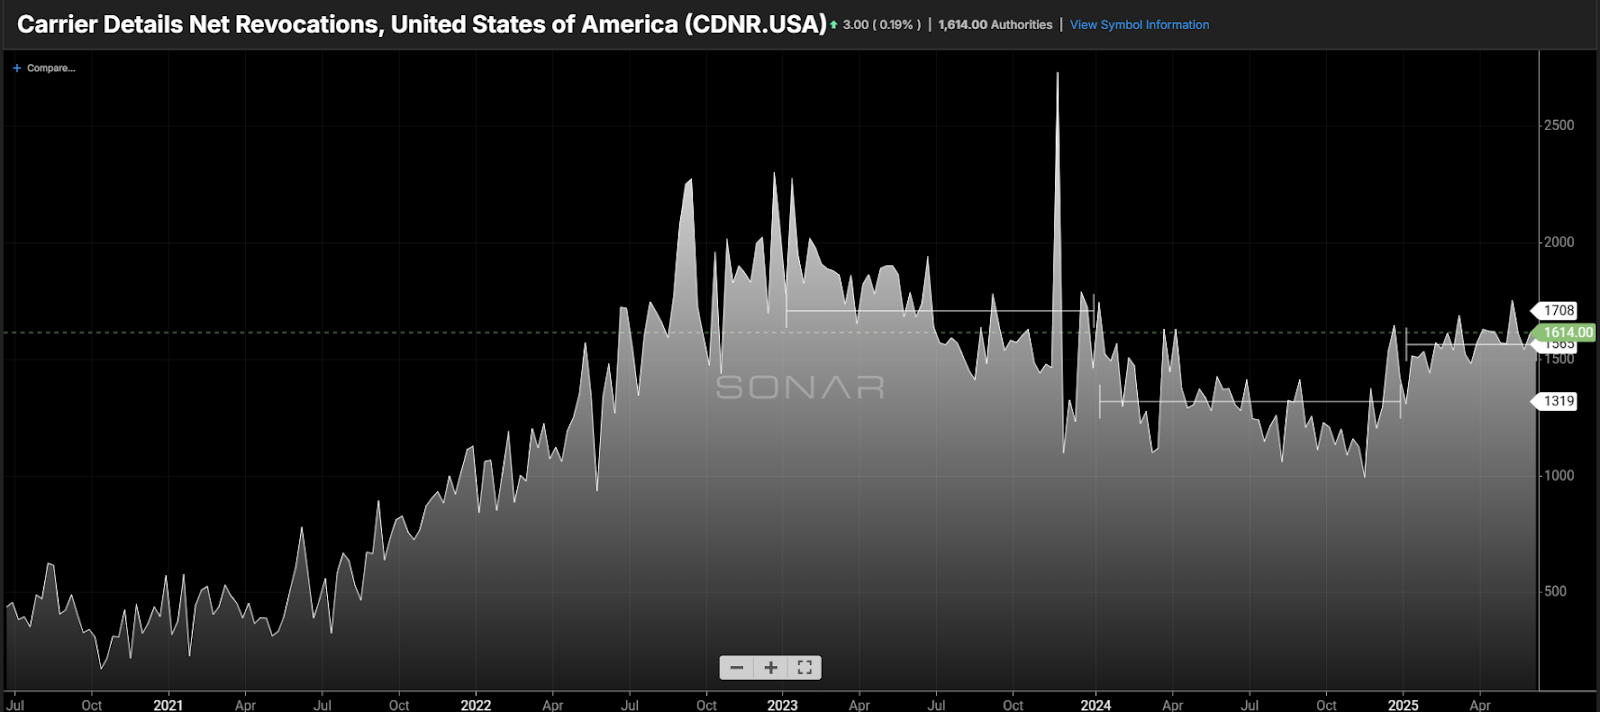
Chart of the Week: Carrier Details Net Revocations – USA SONAR: CDNR.USA
Carrier Net Revocations—which measure how many truckload operators (businesses) are exiting the industry—have remained unseasonably elevated throughout the first half of the year. The current pace of exits is 16% higher than during the same period in 2024. Although new authority issuances have increased this year, they’ve stumbled in recent weeks as new enforcement behaviors and processes may be creating additional barriers to entry.
The U.S. truckload market remains a challenging landscape for many carriers and 3PLs, with demand still too low to support stable business operations. While there has been marginal improvement over the past several years, it hasn’t been enough to push rates high enough to support the current level of capacity. Many structural issues persist, raising the risk of capacity falling to critically low levels.
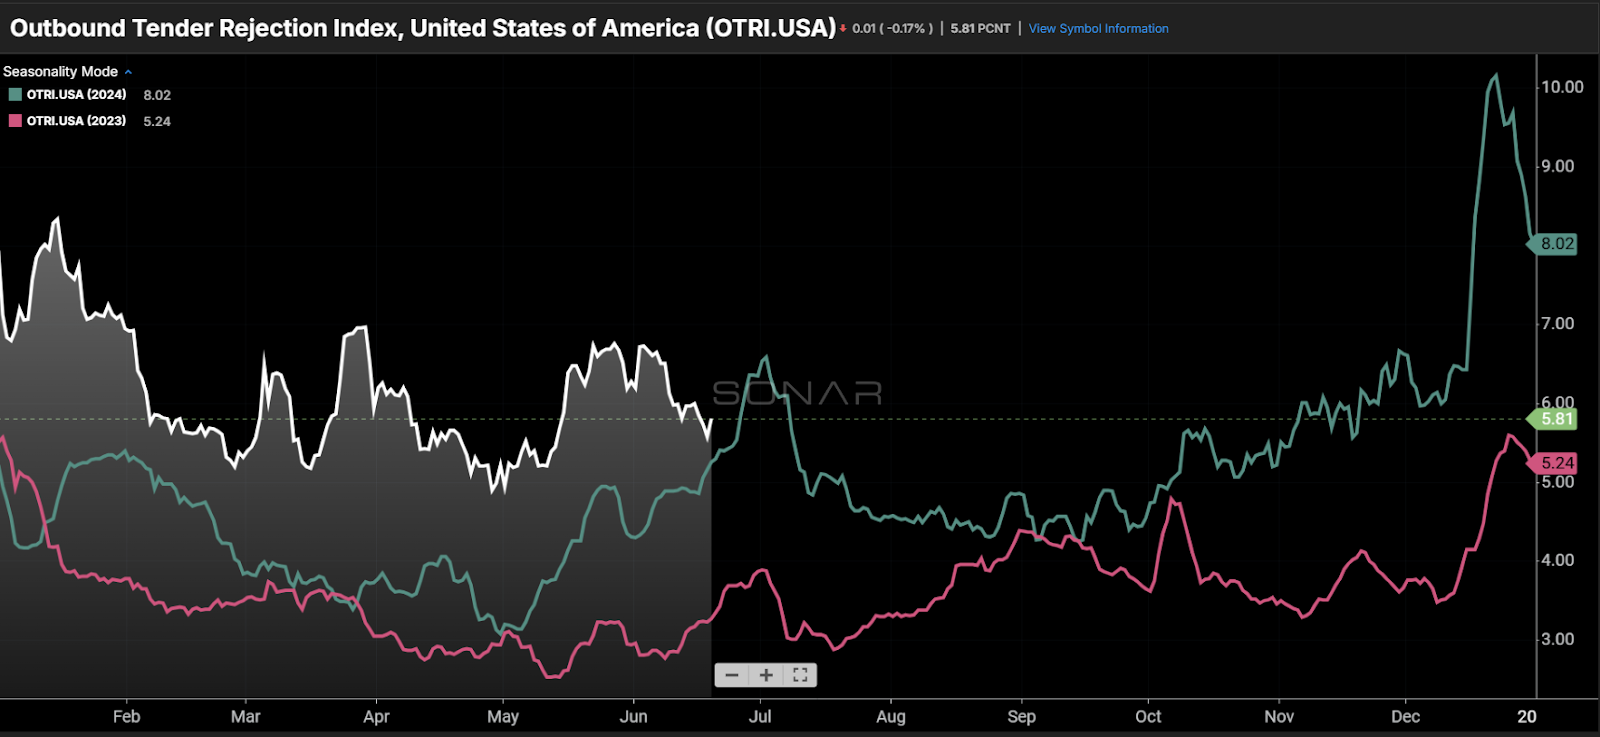
Tender rejection rates (OTRI) — which measure how often carriers decline shipper requests for capacity — have been steadily rising since May 2023. This trend indicates declining carrier availability. In weaker markets, carriers are generally more willing to accept freight, so rising rejection rates in a down market carry more weight.
Lack of profitability
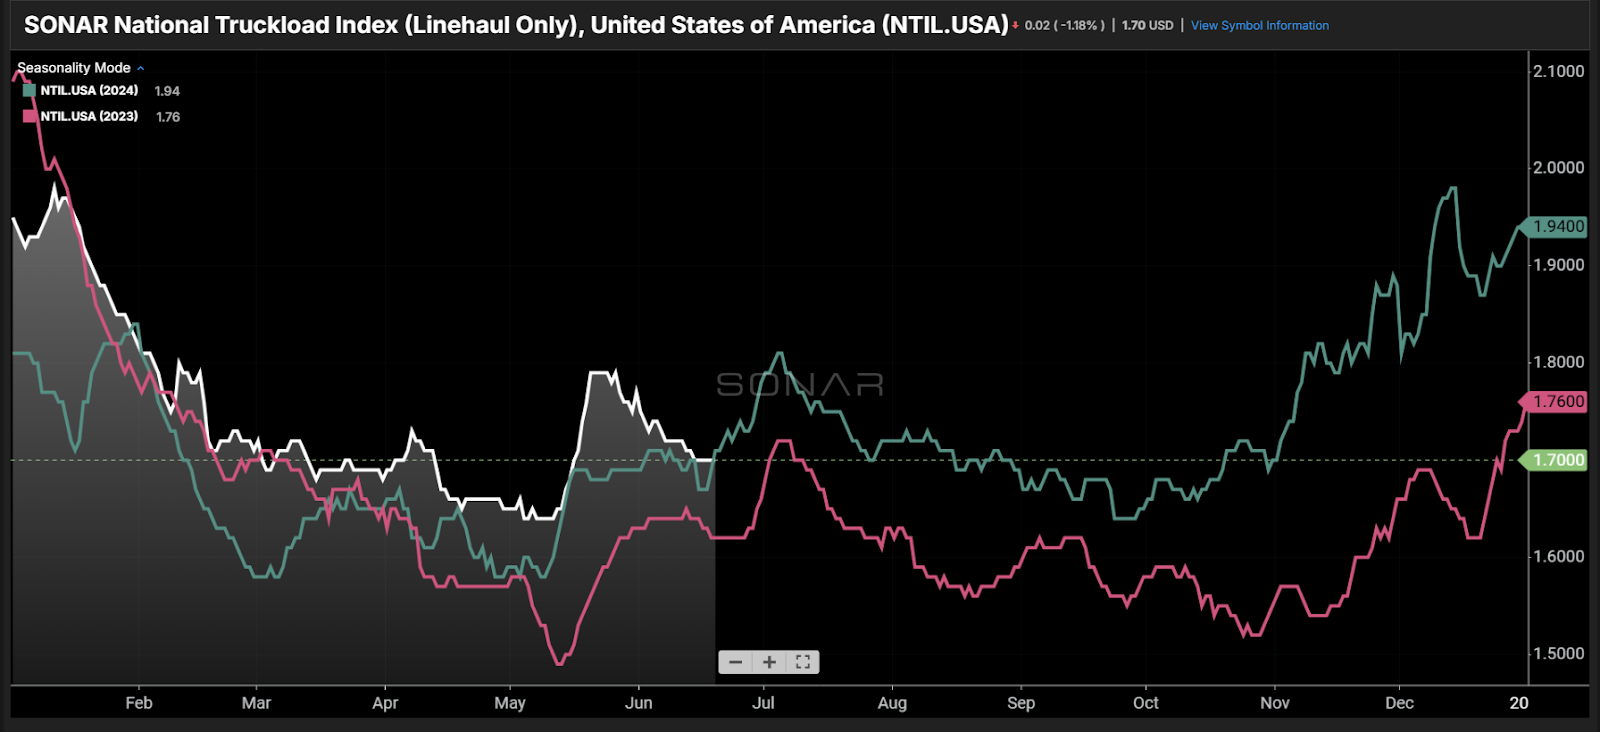
Spot rates (NTIL), traditionally used to gauge truckload market health, have followed a similar upward trajectory. However, rates can be a noisy metric, as fluctuations in haul lengths and inflationary cost inputs can distort the picture. While spot rates are flat year-over-year, operating costs have risen—making profitability more elusive. Diesel prices have declined, offering a rare relief. (Note: fuel costs are excluded from the charted rate index.)
New barriers
In May, the president issued new guidance on enforcing english language proficiency at a state level for drivers. While the specifics of enforcement remain unclear, the move could create additional hurdles for new entrants.
Additionally, efforts to crack down on CDL fraud have intensified, with stricter vetting processes further raising the bar for prospective drivers.
Lack of demand

Tender volumes (OTVI) are down approximately 10–15% compared to this time last year. While much of this decline stems from mode shift—particularly in long-haul freight moving to intermodal—recent trends suggest that overall demand may also be softening.
Beyond the obvious issue of lower demand undermining core business, inconsistent volume makes it harder for carriers to maintain balanced networks, often requiring months to realign.
Matter of time
All these factors point to growing systemic risk in the trucking industry as capacity continues to exit the market. Historically, every major market flip has had a catalyst, but each was preceded by recession-like conditions within the freight space.
The 2017 market boom followed a year and a half of softness. The pandemic surge came after a deep freight recession in 2019. Today’s downturn is one of the longest and most severe on record. The market may have flipped already if not for supply chain lessons learned during COVID and the broader economic uncertainty.
Market inflections are inherently difficult to predict, but the sustained pace of carrier revocations signals that supply is rapidly converging with demand.
About the Chart of the Week
The FreightWaves Chart of the Week is a chart selection from SONAR that provides an interesting data point to describe the state of the freight markets. A chart is chosen from thousands of potential charts on SONAR to help participants visualize the freight market in real time. Each week a Market Expert will post a chart, along with commentary, live on the front page. After that, the Chart of the Week will be archived on FreightWaves.com for future reference.
SONAR aggregates data from hundreds of sources, presenting the data in charts and maps and providing commentary on what freight market experts want to know about the industry in real time.
The FreightWaves data science and product teams are releasing new datasets each week and enhancing the client experience.
To request a SONAR demo, click here.
Brokerage Compliance Symposium
The day before F3. Every compliance issue you face - fraud exposure, carrier liability, FMCSA rules, cargo theft, insurance gaps - navigated by attorneys and operators defining best practices in a changing industry.
F3 Awards Dinner
The night before F3. FreightTech100 companies honored. FreightTech 25 and Shipper of Choice winners revealed live. Cocktail reception into dinner and live music - 300 industry leaders in one purpose-built room.
F3: Future of Freight Festival
Industry-defining keynotes, rapid-fire technology demos, and industry leaders networking in experiences across Chattanooga - plus the inaugural F3 Awards Dinner featuring the FreightTech and Shipper of Choice reveals.
The day before F3. Every compliance issue you face - fraud exposure, carrier liability, FMCSA rules, cargo theft, insurance gaps - navigated by attorneys and operators defining best practices in a changing industry.
The Signal at Chattanooga Choo Choo • Chattanooga, TN Register NowThe night before F3. FreightTech100 companies honored. FreightTech 25 and Shipper of Choice winners revealed live. Cocktail reception into dinner and live music - 300 industry leaders in one purpose-built room.
The Signal at Chattanooga Choo Choo • Chattanooga, TN Register NowIndustry-defining keynotes, rapid-fire technology demos, and industry leaders networking in experiences across Chattanooga - plus the inaugural F3 Awards Dinner featuring the FreightTech and Shipper of Choice reveals.
The Signal at Chattanooga Choo Choo • Chattanooga, TN Register Now