Chart of the Week: Outbound Tender Volume Index – USA, Dallas, Ontario, Atlanta SONAR: OTVI.USA, OTVI.DAL, OTVI.ONT, OTVI.ATL
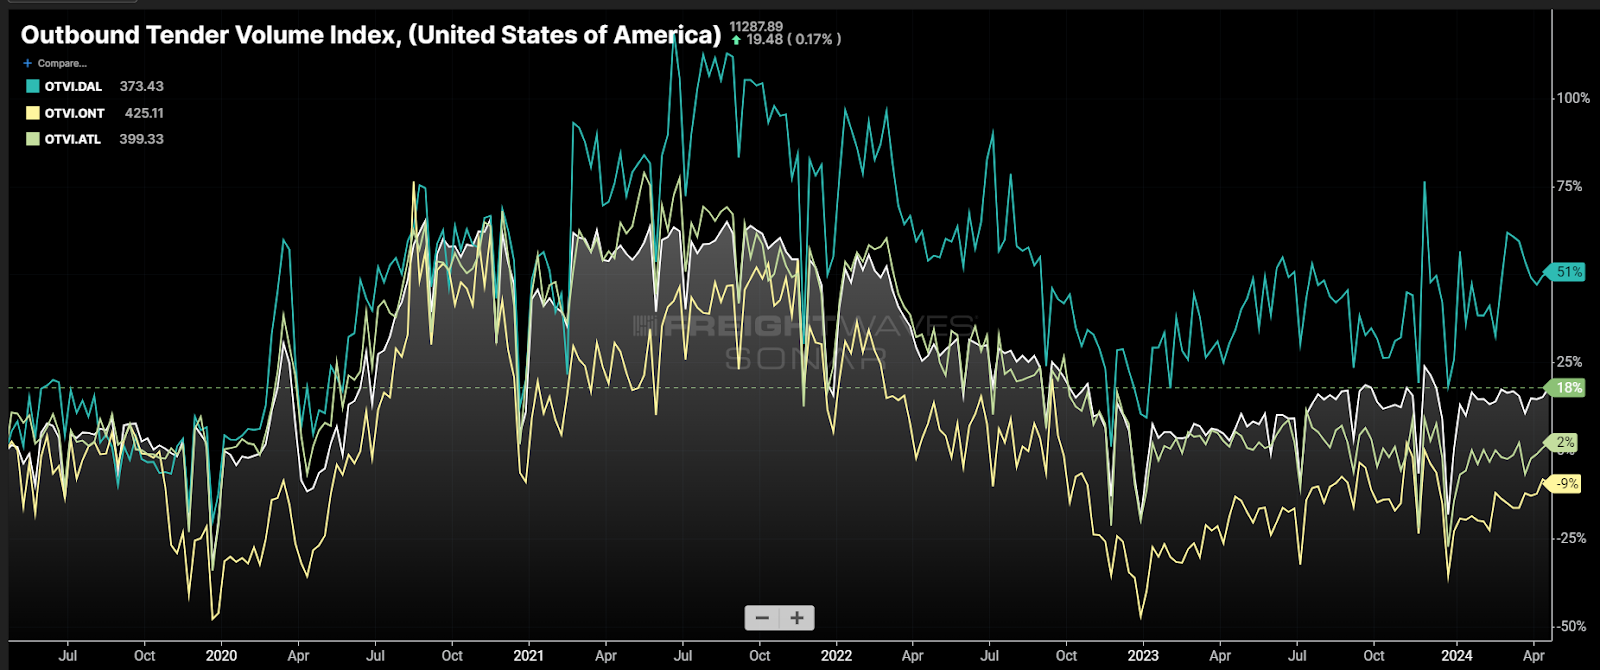
Dallas’ outbound tender volumes (OTVI.DAL) have grown approximately 50% over the past five years compared to the national average of 18%. The two largest outbound markets in the U.S. — Ontario, California, and Atlanta — have both lost significant share. The ongoing capacity glut is hiding a rather significant shift in national freight flow patterns.
In a more balanced market, freight demand changes are discovered through isolated pockets of tightening, where spot rates increase and carriers flock to cover the freight. In the current market, where supply is abundant, there is no tightening or increased rates as carriers are nearly sitting on the sides of the streets ready to pounce.
Five years may sound like a long time, but in terms of supply chain infrastructure it is relatively brief. The process of deciding where to place and then build warehouses and distribution centers takes many years.
The pandemic-fueled economic volatility has possibly created a sense of urgency around diversifying procurement and sourcing strategies. The results of this have fractured a stagnant national freight transportation network that had been entrenched for at least a decade.
This isn’t to say that this shift has completely rearranged freight across the U.S. Ontario and Atlanta remain the largest outbound markets, but their dominance has waned significantly as they have lost share to some of the smaller markets.
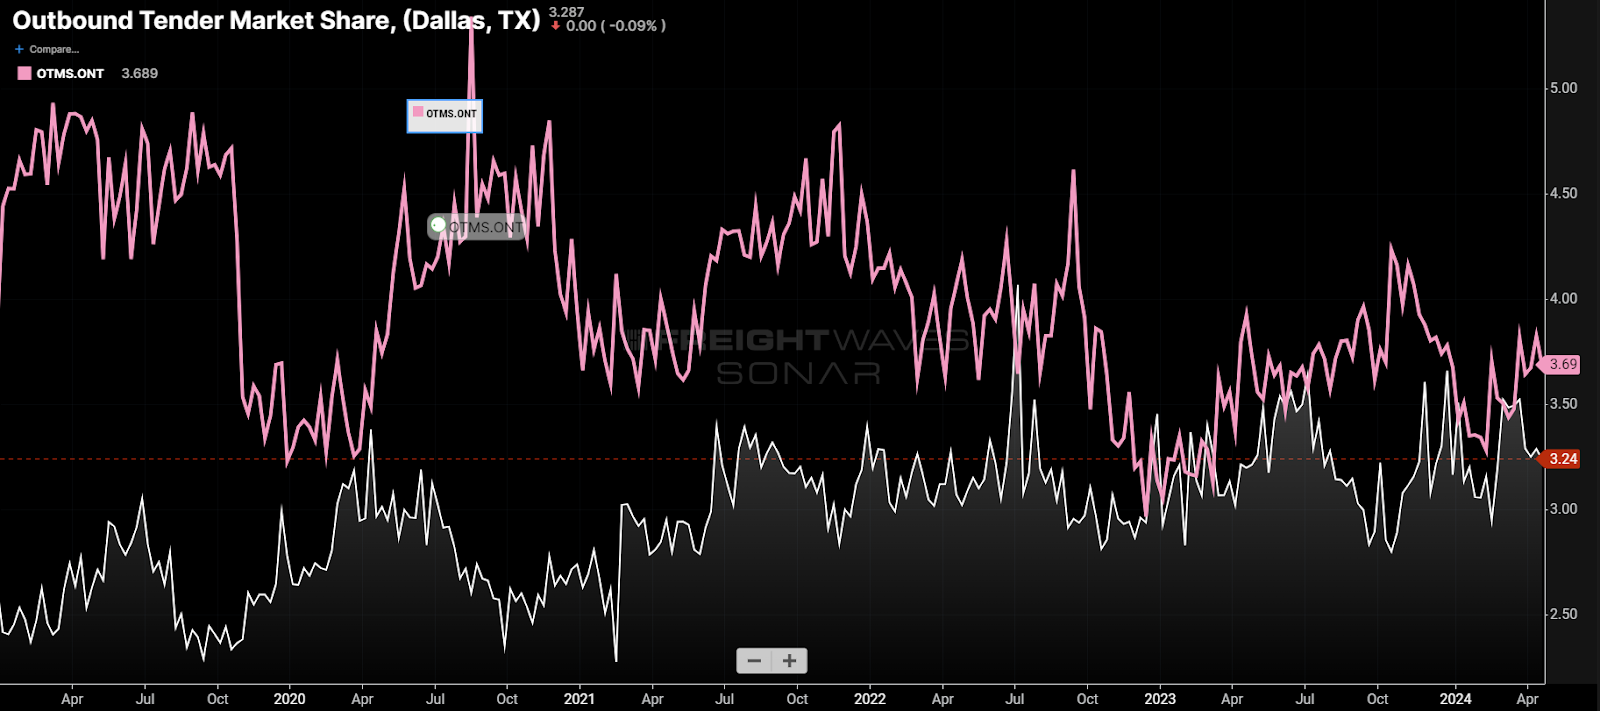
The Dallas market was not a small market in 2019, representing approximately 2.7% of the total national outbound freight volume (or market share) that April. It has averaged around 3.3% this month. Ontario has shrunk from a 4.8% Outbound Tender Market Share (OTMS) value to 3.7%.
Dallas is not the only market that has grown significantly relative to the others. Phoenix demand is up approximately 60% since April 2019 and currently originates over 2% of all national tenders compared to about 1.1% five years ago.
While changes in market share do not necessarily mean a market has grown or deteriorated in terms of absolute freight volume, it does mean that transportation networks have to adjust to meet the needs of shippers.
Carrier networks are built on consistency and knowing when and where freight will be available. Changes in either of these mean that carriers need to find a way to get their trucks into the places they are needed more often.
If they are unaware of these shifting patterns, thanks to a veil of abundant capacity, then they will not be actively trying to adjust. It takes several months for a carrier to rebalance its network.
The reason this is important is that once capacity recedes to a more balanced level with demand, trucking rates will go through their own rebalancing. This will mean some areas of the country will have lower rates, while others will see increases. The areas that have fallen out of balance will also be more exposed to service disruptions.
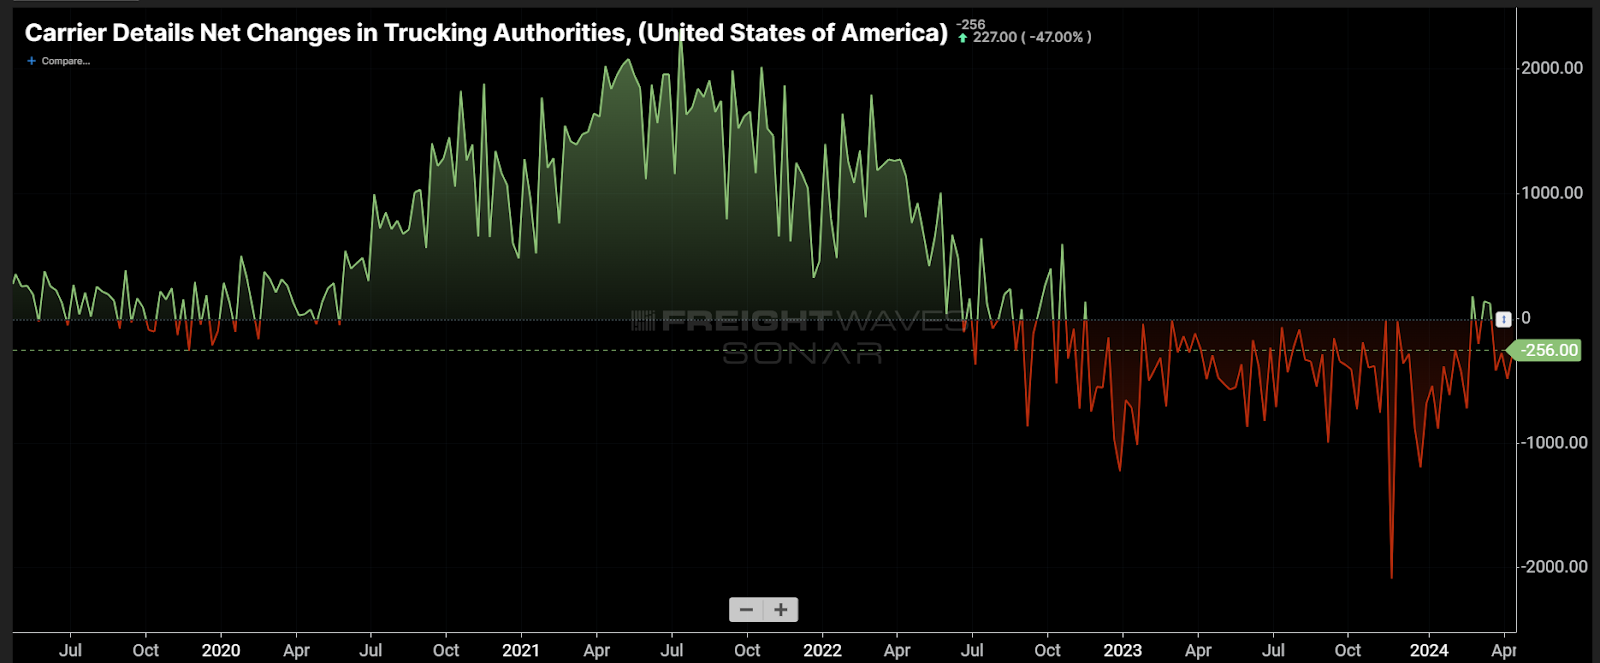
Capacity is exiting at a record pace, according to Carrier Details analysis of Federal Motor Carrier Safety Administration data. Many expect the market to be more balanced later this year, which will expose these freight transportation pattern shifts more prominently.
Shippers who have facilities in these emerging markets should be wary of changing pricing conditions. Service providers should be proactive in targeting these areas operationally.
About the Chart of the Week
The FreightWaves Chart of the Week is a chart selection from SONAR that provides an interesting data point to describe the state of the freight markets. A chart is chosen from thousands of potential charts on SONAR to help participants visualize the freight market in real time. Each week a Market Expert will post a chart, along with commentary, live on the front page. After that, the Chart of the Week will be archived on FreightWaves.com for future reference.
SONAR aggregates data from hundreds of sources, presenting the data in charts and maps and providing commentary on what freight market experts want to know about the industry in real time.
The FreightWaves data science and product teams are releasing new datasets each week and enhancing the client experience.
To request a SONAR demo, click here.
Brokerage Compliance Symposium
The day before F3. Every compliance issue you face - fraud exposure, carrier liability, FMCSA rules, cargo theft, insurance gaps - navigated by attorneys and operators defining best practices in a changing industry.
F3 Awards Dinner
The night before F3. FreightTech100 companies honored. FreightTech 25 and Shipper of Choice winners revealed live. Cocktail reception into dinner and live music - 300 industry leaders in one purpose-built room.
F3: Future of Freight Festival
Industry-defining keynotes, rapid-fire technology demos, and industry leaders networking in experiences across Chattanooga - plus the inaugural F3 Awards Dinner featuring the FreightTech and Shipper of Choice reveals.
The day before F3. Every compliance issue you face - fraud exposure, carrier liability, FMCSA rules, cargo theft, insurance gaps - navigated by attorneys and operators defining best practices in a changing industry.
The Signal at Chattanooga Choo Choo • Chattanooga, TN Register NowThe night before F3. FreightTech100 companies honored. FreightTech 25 and Shipper of Choice winners revealed live. Cocktail reception into dinner and live music - 300 industry leaders in one purpose-built room.
The Signal at Chattanooga Choo Choo • Chattanooga, TN Register NowIndustry-defining keynotes, rapid-fire technology demos, and industry leaders networking in experiences across Chattanooga - plus the inaugural F3 Awards Dinner featuring the FreightTech and Shipper of Choice reveals.
The Signal at Chattanooga Choo Choo • Chattanooga, TN Register Now