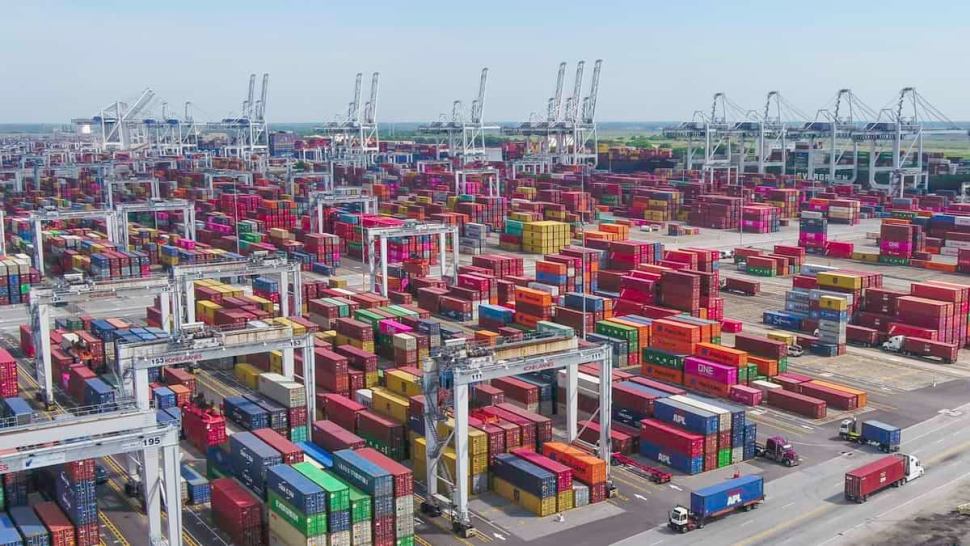
The import stats at U.S. ports just went ballistic. Year-on-year (y/y) gains skyrocketed for two reasons. First, March volumes were unusually strong — as high as the peak in October. Second, import volumes in March 2020 were unusually weak, suppressed by the initial COVID lockdowns.
This confluence led to some eye-catching statistics published by The McCown Report on Thursday: Imports to the top 10 U.S. container ports rose 67.8% y/y. Imports to East/Gulf Coast ports rose by 48.5%. Those to West Coast ports rose by 89.5%.
Adviser John McCown, who compiles the monthly data for the report, called the March numbers “incredible,” with “most of the top 10 ports reporting their largest year-over gains in memory.”
March matches October peak
“Total volume in March was almost identical to what it was five months earlier, in October, traditionally the highest-volume month owing to holiday shipments,” said McCown. “March is usually the lowest-volume month of the year due to the Chinese New Year effect. This year, however, most of the plants in China remained open throughout the New Year’s celebration and there was no lull that reduced March volume.”

McCown’s data shows a 15% y/y decrease in imports at the top 10 ports in March 2020, leading to an easy comparable for last month. Even so, the y/y gain for the three trailing months (i.e., the first quarter) highlights the depth of the current import strength. According to The McCown Report, three-month trailing volume was up 32.5% — 23.6% for East/Gulf Coast ports and 41.7% for West Coast ports.
Looking at individual ports, trailing three-month volumes rose the most in Los Angeles (+48.1%), followed by Long Beach (+44.5%), Savannah, Georgia (+32.8) and Seattle/Tacoma (+32.2%).
Import-export gap widening

The trend is entirely different on the export front.
Outbound container volume did increase 0.8% y/y in March, but this was the first gain after 12 consecutive monthly declines. The trailing three-month volume was down 6.6%.
“There is a widening gap between inbound and outbound performance,” said McCown.
Looking beyond March
The trends seen in March — double-digit y/y gains for imports and a widening spread between imports and exports — look virtually guaranteed to persist for at least the next several months, particularly given that there are weak prior-year comparables through July 2020.
The Commerce Department reported Thursday that retail sales spiked by 9.8% in March. That spending will intensify the need for retailers to restock inventories, which will support import demand in the months ahead.
Other indicators point to continued strength, as well.
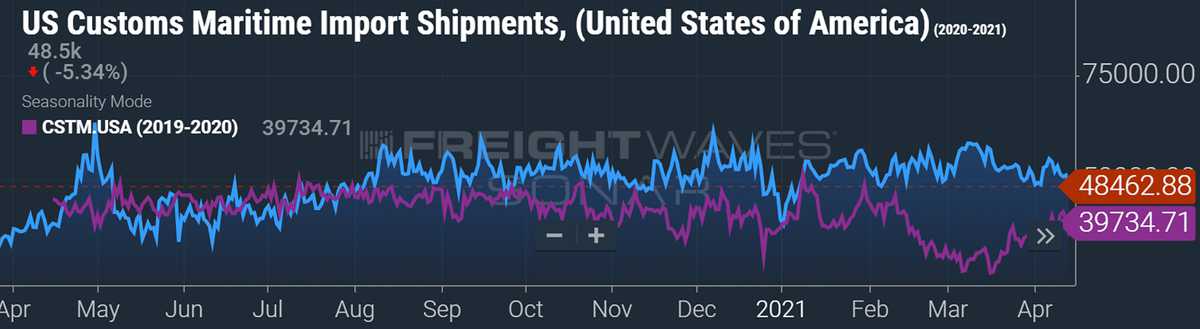
Data from U.S. Customs on the number of maritime import shipments arriving in the country per day (SONAR: CSTM.USA) shows no let-up this month (numbers are a seven-day trailing average and do not account for differing volumes per bill of lading). The number of inbound shipments is still on par with where it stood during the peak fourth-quarter period.
FreightWaves’ SONAR platform also features a proprietary index of shippers’ ocean bookings. Bookings to the U.S. are measured on a 10-day-moving-average basis in terms of twenty-foot equivalent units (TEUs) as of the scheduled date of overseas departure. Given the voyage times from different load ports around the world, a high index number in mid-April implies high import volumes in May.
This dataset (SONAR: IOTI.USA) is indexed to Jan. 1, 2019. It hit its highest point since then in late March 2020, during the sudden wave of catch-up bookings following the initial Wuhan lockdown. The index came within a few points of breaking that record on Monday.
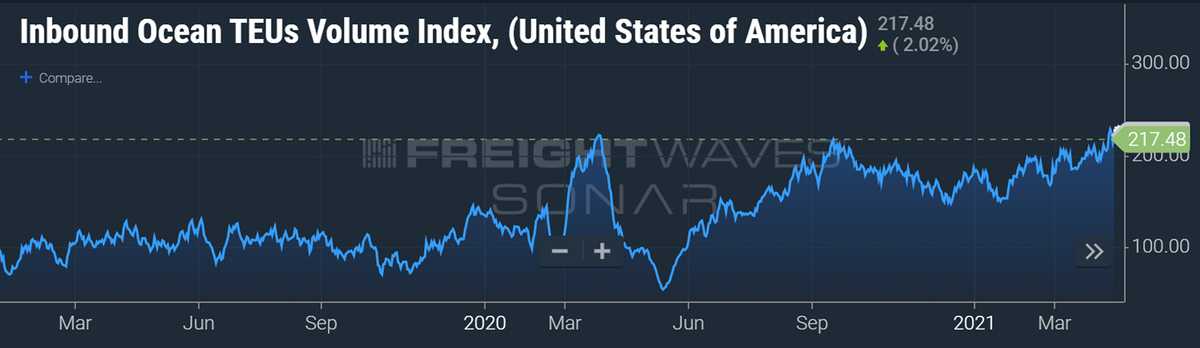
The dataset also includes booking data for cargo scheduled to depart over the coming week. The forward data shows that a new all-time high for the U.S.-inbound TEU index will be reached next Tuesday. This strongly implies that the extraordinarily high numbers recorded at U.S. ports in March will be followed by more big numbers ahead.

Click for more articles by Greg Miller
Related articles:
Brokerage Compliance Symposium
The day before F3. Every compliance issue you face - fraud exposure, carrier liability, FMCSA rules, cargo theft, insurance gaps - navigated by attorneys and operators defining best practices in a changing industry.
F3 Awards Dinner
The night before F3. FreightTech100 companies honored. FreightTech 25 and Shipper of Choice winners revealed live. Cocktail reception into dinner and live music - 300 industry leaders in one purpose-built room.
F3: Future of Freight Festival
Industry-defining keynotes, rapid-fire technology demos, and industry leaders networking in experiences across Chattanooga - plus the inaugural F3 Awards Dinner featuring the FreightTech and Shipper of Choice reveals.
The day before F3. Every compliance issue you face - fraud exposure, carrier liability, FMCSA rules, cargo theft, insurance gaps - navigated by attorneys and operators defining best practices in a changing industry.
The Signal at Chattanooga Choo Choo • Chattanooga, TN Register NowThe night before F3. FreightTech100 companies honored. FreightTech 25 and Shipper of Choice winners revealed live. Cocktail reception into dinner and live music - 300 industry leaders in one purpose-built room.
The Signal at Chattanooga Choo Choo • Chattanooga, TN Register NowIndustry-defining keynotes, rapid-fire technology demos, and industry leaders networking in experiences across Chattanooga - plus the inaugural F3 Awards Dinner featuring the FreightTech and Shipper of Choice reveals.
The Signal at Chattanooga Choo Choo • Chattanooga, TN Register Now