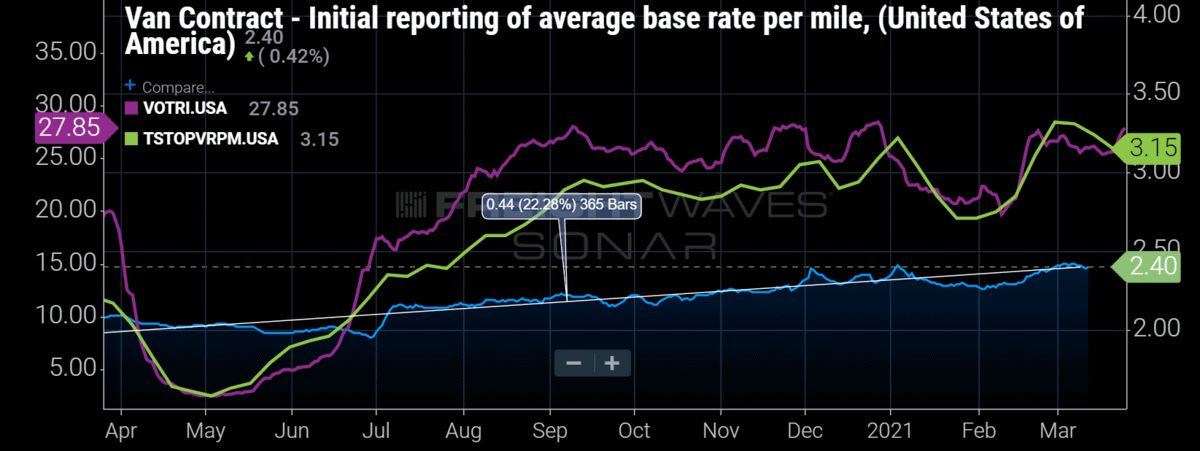
Chart of the Week: Van Contract Base Rate per Mile Initial, Van Outbound Tender Reject Index, Truckstop Average Van Spot Rate per Mile – USA SONAR: VCRPM1.USA, VOTRI.USA, TSTOPVRPM.USA
Truckload carriers have continued to struggle to provide consistent coverage through the first quarter of 2021, and in return costs have increased. This relationship seems counterintuitive at a base level — why would you spend more to get less? — but it is a common result of demand exceeding supply in just about any industry.
National van truckload tender rejection rates — the percent of electronic requests for capacity declined by carriers — have exceeded 20% since early August outside of a single day in February. The truckload market appeared to be on a path toward stability with rejection rates sliding slowly through the first month of the year before winter storms disrupted trucking networks and shipper production cycles. The result has been rejection rates consistently above 25% since Feb. 18.
With decreasing carrier compliance come increasing transportation rates. The average van truckload spot rate increased 20% from the beginning to the end of February, according to Truckstop.com. Spot rates are much more volatile and represent roughly 10%-20% of the for-hire truckload market freight volume. Most of the freight moves under a more consistent pricing structure or “contract” rates.
The overall average cost of a dry van truckload move increased 6% over the same period, according to FreightWaves’ Van Contract Index, which measures the average median base rate per mile of truckload invoices on a daily basis. This index largely consists of long-term contracted freight rates and excludes loads under 250 miles.
It should be noted that retail fuel costs also increased roughly 12% last month, according to the Department of Energy, which influences the spot rates, but fuel surcharges have been removed from the contract rates.
Contract or long-term rates do not change quickly compared with spot rates, but as shippers fall down their list of providers, looking for someone to move their freight, rates tend to increase and service expectations deteriorate. This is largely the increase shown here. A portion of the increase could also be due to rate increase implementations, but that is difficult to determine with precision in such a volatile space.
The big question is, just now what can shippers do about it? Looking at this week’s chart, it is apparent that most contract rates were underpriced for the market conditions for most of the past year. Compliance levels fell rapidly, leading to surging spot pricing.
As mentioned, contract rates are slow to move and remain well below spot levels. The further the contract rate is below spot, the lower the compliance and service level shippers experience.
Unlike previous years when the market was more stable, shippers will have a tough time finding the sweet spot that balances price and service/compliance levels. Optimizing this function with so many uncertainties makes budgeting transportation spend a nightmare. The traditional strategy of relying on leverage will probably not work as well this year.
Price too low and risk paying spot market premiums of 30%-50%. Spend too much to guarantee higher compliance and that is also a problem. With average invoiced rate levels 22% higher than the previous year, according to the Van Contract Index, there is less room to negotiate.
Some mean reversion is imminent, but the national Outbound Tender Reject Index shot back over 28% this week, near its peak value around Thanksgiving of this past year. This indicates demand continues to outpace capacity and many of the recently implemented contracts have been unsuccessful. Transportation managers will have to be more nimble than ever if they want to keep from being the scapegoat on this year’s earnings calls.
About the Chart of the Week
The FreightWaves Chart of the Week is a chart selection from SONAR that provides an interesting data point to describe the state of the freight markets. A chart is chosen from thousands of potential charts on SONAR to help participants visualize the freight market in real time. Each week a market expert will post a chart, along with commentary, live on the front page. After that, the Chart of the Week will be archived on FreightWaves.com for future reference.
SONAR aggregates data from hundreds of sources, presenting the data in charts and maps and providing commentary on what freight market experts want to know about the industry in real time.
The FreightWaves data science and product teams are releasing new datasets each week and enhancing the client experience. To request a SONAR demo, click here.
Brokerage Compliance Symposium
The day before F3. Every compliance issue you face - fraud exposure, carrier liability, FMCSA rules, cargo theft, insurance gaps - navigated by attorneys and operators defining best practices in a changing industry.
F3 Awards Dinner
The night before F3. FreightTech100 companies honored. FreightTech 25 and Shipper of Choice winners revealed live. Cocktail reception into dinner and live music - 300 industry leaders in one purpose-built room.
F3: Future of Freight Festival
Industry-defining keynotes, rapid-fire technology demos, and industry leaders networking in experiences across Chattanooga - plus the inaugural F3 Awards Dinner featuring the FreightTech and Shipper of Choice reveals.
The day before F3. Every compliance issue you face - fraud exposure, carrier liability, FMCSA rules, cargo theft, insurance gaps - navigated by attorneys and operators defining best practices in a changing industry.
The Signal at Chattanooga Choo Choo • Chattanooga, TN Register NowThe night before F3. FreightTech100 companies honored. FreightTech 25 and Shipper of Choice winners revealed live. Cocktail reception into dinner and live music - 300 industry leaders in one purpose-built room.
The Signal at Chattanooga Choo Choo • Chattanooga, TN Register NowIndustry-defining keynotes, rapid-fire technology demos, and industry leaders networking in experiences across Chattanooga - plus the inaugural F3 Awards Dinner featuring the FreightTech and Shipper of Choice reveals.
The Signal at Chattanooga Choo Choo • Chattanooga, TN Register Now