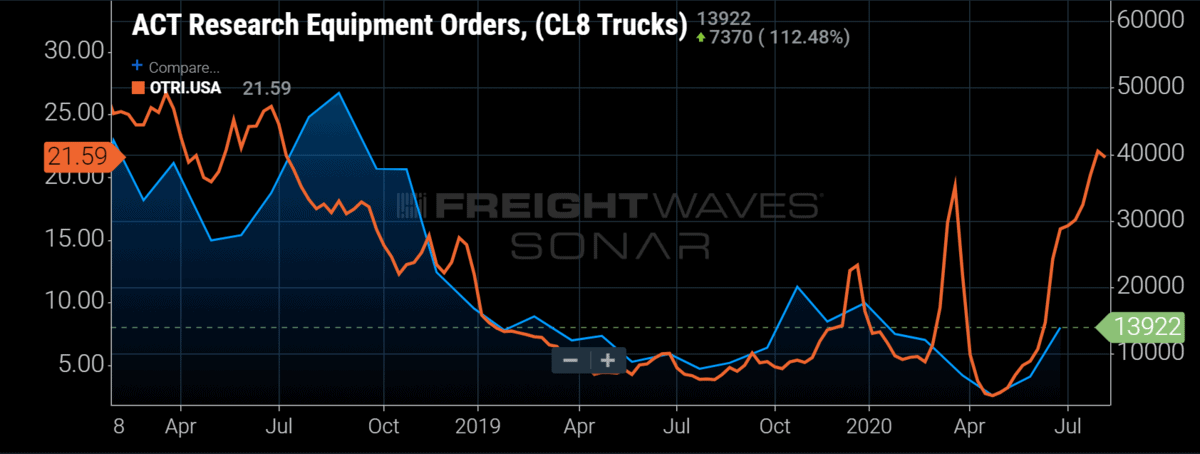
Chart of the Week: ACT Research Class 8 Truck Orders, Outbound Tender Rejection Index – USA SONAR: ORDERS.CL8, OTRI.USA
If the COVID-19 pandemic has taught us anything, it is not to rely too heavily on the patterns and connections that helped us understand the world around us prior to the outbreak. While some connections remain intact – like tighter capacity leads to higher rates – there are many whose relationships have become disconnected. Key ones include between some of the macroeconomic measures and the trucking industry. The big question moving forward for surface transportation is “will capacity return like it did in 2018 after an extended period with an overheated spot market?”
To figure this out we need to look at the relationship between capacity and truck orders. Acknowledging these are not the only two measures we can observe, these are some of the purer variables when observing the freight market.
Tender rejection rates, or the rate at which a carrier rejects electronic requests for capacity, are highly correlated with increased spot market rates and activity. When rejection rates increase, spot rates do as well. When spot rates increase, carrier revenues increase as well as profit margins and cash flow. When carriers get cash they tend to invest in expanding their fleets because that is how they grow.
Looking at the chart of national tender rejections and Class 8 truck orders, there is a strong connection between extended periods of elevated tender rejection rates and truck orders. In 2018, rejection rates hovered above 19% through the first half of the year as new truck orders reported by ACT Research averaged 110% higher year-over-year (y/y) from April through October.
New truck orders take six to nine months on average to complete, which means carriers are making a long-term bet on the need for this equipment. In other words, they cannot expect to put the truck out on the road right away in the current environment. Once they order the truck they need to make plans to seat it with a driver as well.
It is true that many of the new truck orders are not meant to expand a fleet, but replace older units. The difference in 2018 was the sheer volume of new orders over that of a typical year was well beyond a normal range of fleet replenishment.
At the present time, there has been a longer trend of rejection rates above 15% emerging over the past two months. Class 8 orders were roughly 38% higher in June y/y, which is nowhere near the expansion of 2018, but the increase does indicate carriers have a more positive outlook than they had a year earlier. In difficult times carriers will let their fleets age instead of replacing them.
There are a lot of differences between the expansion of orders in 2018 and today. There was more optimism over the sustainability of the elevated rates and restriction of capacity that electronic logging devices was supposed to bring. Little certainty exists over just about anything in 2020.
There is no doubt that some investment is being made in equipment already. However, the true measure of capacity will be if drivers who left the space will return to seat those trucks, or if more will enter. Driving schools were shuttered in the early phase of the outbreak, which will delay many new entrants in some of the larger fleets. But as some of the stimulus benefits run out there are certainly those that will find their way back into work as it becomes necessary. The current environment will entice the self-employed owner-operator to re-enter as well, but just how many will depend on the length of the current rate boom.
About the Chart of the Week
The FreightWaves Chart of the Week is a chart selection from SONAR that provides an interesting data point to describe the state of the freight markets. A chart is chosen from thousands of potential charts on SONAR to help participants visualize the freight market in real time. Each week a Market Expert will post a chart, along with commentary, live on the front page. After that, the Chart of the Week will be archived on FreightWaves.com for future reference.
SONAR aggregates data from hundreds of sources, presenting the data in charts and maps and providing commentary on what freight market experts want to know about the industry in real time.
The FreightWaves data science and product teams are releasing new data sets each week and enhancing the client experience.
To request a SONAR demo, click here.
Brokerage Compliance Symposium
The day before F3. Every compliance issue you face - fraud exposure, carrier liability, FMCSA rules, cargo theft, insurance gaps - navigated by attorneys and operators defining best practices in a changing industry.
F3 Awards Dinner
The night before F3. FreightTech100 companies honored. FreightTech 25 and Shipper of Choice winners revealed live. Cocktail reception into dinner and live music - 300 industry leaders in one purpose-built room.
F3: Future of Freight Festival
Industry-defining keynotes, rapid-fire technology demos, and industry leaders networking in experiences across Chattanooga - plus the inaugural F3 Awards Dinner featuring the FreightTech and Shipper of Choice reveals.
The day before F3. Every compliance issue you face - fraud exposure, carrier liability, FMCSA rules, cargo theft, insurance gaps - navigated by attorneys and operators defining best practices in a changing industry.
The Signal at Chattanooga Choo Choo • Chattanooga, TN Register NowThe night before F3. FreightTech100 companies honored. FreightTech 25 and Shipper of Choice winners revealed live. Cocktail reception into dinner and live music - 300 industry leaders in one purpose-built room.
The Signal at Chattanooga Choo Choo • Chattanooga, TN Register NowIndustry-defining keynotes, rapid-fire technology demos, and industry leaders networking in experiences across Chattanooga - plus the inaugural F3 Awards Dinner featuring the FreightTech and Shipper of Choice reveals.
The Signal at Chattanooga Choo Choo • Chattanooga, TN Register Now