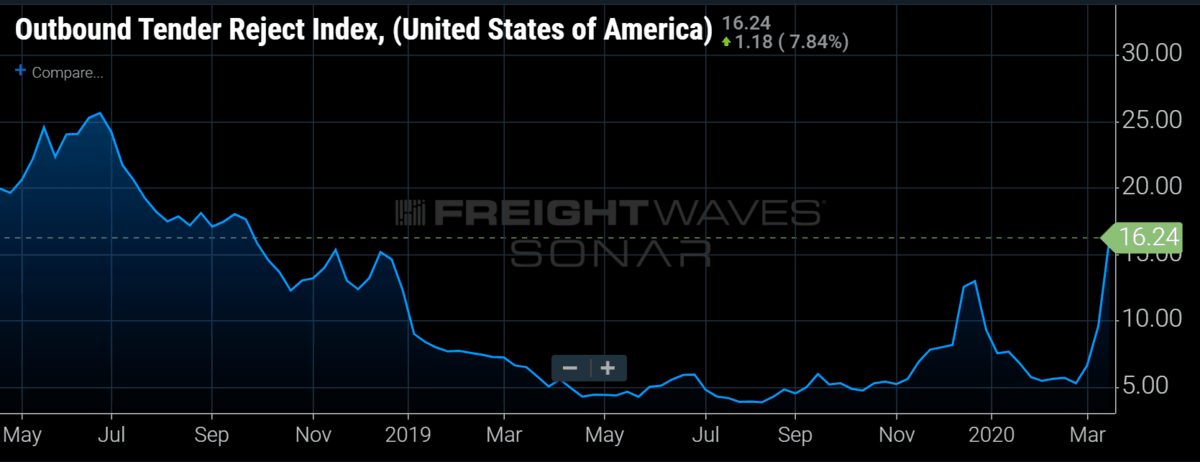
Chart of the Week: Outbound Tender Rejection Index – USA SONAR: OTRI.USA
With the nation struggles with a pandemic, many carriers have found themselves overwhelmed by the sharp increase in demand over the past three weeks, which has led to the highest load rejection rate since September of 2018. This spike is probably temporary, however.
The Outbound Tender Rejection Index (OTRI) measures the rate at which carriers reject customer requests to pick-up freight. The data is heavily skewed towards contracted business, meaning most of the requests are between a carrier and shipper who have an existing relationship and agreed upon rates. Seeing as carriers are generally in a constant search for freight, rejecting opportunities from an existing customer means they are either too busy to provide capacity or have a much better (paying) option. In this case, they appear to be the former. Increasing rejection rates typically indicate upward rate pressure while declining rejections indicates the opposite.
Volumes rapidly surged starting in March as the threat of the coronavirus became a reality for many Americans. One of the main mechanisms Americans have used to alleviate anxiety is the hoarding of food products and household goods like paper towels and strangely enough, toilet paper.
The national OTRI was relatively flat in February, moving down slightly from 5.76% to 5.29%. Since February 29, national rejection rates have increased every day. As of March 20, the national OTRI was 16.24%, 972 basis points higher than the same time in 2019. On March 9 the OTRI surpassed the previous year’s value for the first time since inception in early 2018.
This tightness is far different from the 2018 scenario, however. This event is expected to be short lived in terms of trucking volumes and capacity, whereas the 2018 situation was much more long-running. In many cases of extreme volatility, violent upswings can produce even stronger downswings.
Most experts and financial institutions are uncertain about how deep the economic trough will go. Goldman Sachs forecasted a 24% decline in GDP in the second quarter of 2020, by far the most severe estimate. Whereas this may be on the low end, most forecasts are pretty grim for the economy over the next three months, meaning that freight volumes should follow suit as consumption dwindles as people are in quarantine.
There are still many unknowns, but employment levels are taking their first significant hit — the Department of Labor reporting a 30% increase in unemployment claims last week. Less people working leads to less spending, which leads to less freight moving. With less freight moving, capacity should loosen proportionately, pending some unforeseen hit to the driver population such as widespread infection.
Certain commodities, such as food and medical supplies, will remain in high demand throughout the pandemic, but other industries like automotive and non-perishable manufacturing will take an inevitable hit, leaving many trucks without enough freight to haul.
It took roughly 6-8 weeks for China to get the outbreak under control by shutting down sections of the country. The U.S. just started to implement a similar strategy over the past week or two, which would put conditions stabilizing in late April or early May.
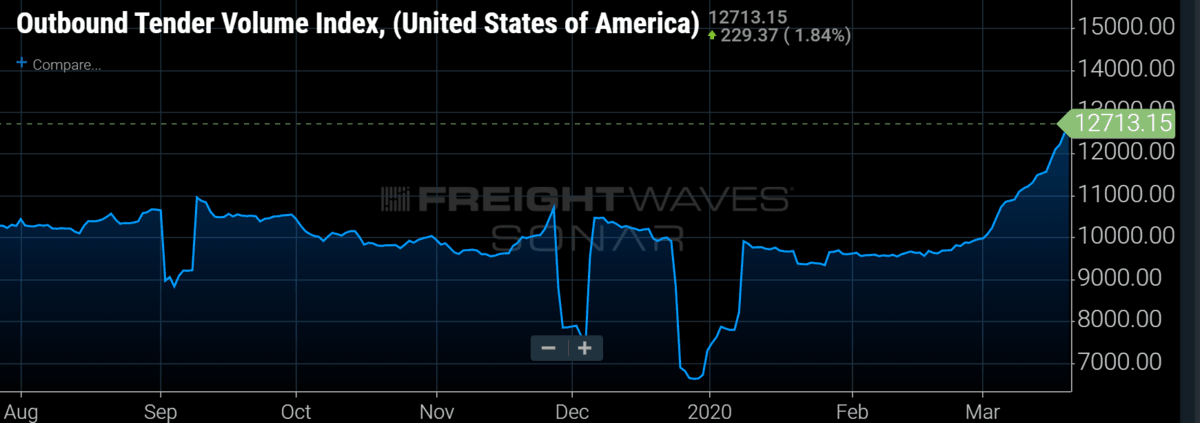
Volumes are still on the rise as of March 20 — the national Outbound Tender Volume Index (OTVI) having risen to an all-time high since its creation date in March of 2018 for the 10th consecutive day. Predicting when it will fall with precision is near impossible, but the odds of it remaining on its current course for much longer get lower each day. Once it crests, the expectation will be for a similar decline as volumes regress back towards seasonal levels and eventually below them. It has taken three weeks to get to this point — volumes 27% higher than the same time last year — to say this is an anomaly would be the understatement of the year.
If volumes begin to fall on the same pace this week, we will see volumes back to early March levels by April 10. Capacity and rejection rates should quickly follow suit.
About the Chart of the Week
The FreightWaves Chart of the Week is a chart selection from SONAR that provides an interesting data point to describe the state of the freight markets. A chart is chosen from thousands of potential charts on SONAR to help participants visualize the freight market in real-time. Each week a Market Expert will post a chart, along with commentary live on the front-page. After that, the Chart of the Week will be archived on FreightWaves.com for future reference.
SONAR aggregates data from hundreds of sources, presenting the data in charts and maps and providing commentary on what freight market experts want to know about the industry in real time.
The FreightWaves data science and product teams are releasing new data sets each week and enhancing the client experience.
To request a SONAR demo click here.
Brokerage Compliance Symposium
The day before F3. Every compliance issue you face - fraud exposure, carrier liability, FMCSA rules, cargo theft, insurance gaps - navigated by attorneys and operators defining best practices in a changing industry.
F3 Awards Dinner
The night before F3. FreightTech100 companies honored. FreightTech 25 and Shipper of Choice winners revealed live. Cocktail reception into dinner and live music - 300 industry leaders in one purpose-built room.
F3: Future of Freight Festival
Industry-defining keynotes, rapid-fire technology demos, and industry leaders networking in experiences across Chattanooga - plus the inaugural F3 Awards Dinner featuring the FreightTech and Shipper of Choice reveals.
The day before F3. Every compliance issue you face - fraud exposure, carrier liability, FMCSA rules, cargo theft, insurance gaps - navigated by attorneys and operators defining best practices in a changing industry.
The Signal at Chattanooga Choo Choo • Chattanooga, TN Register NowThe night before F3. FreightTech100 companies honored. FreightTech 25 and Shipper of Choice winners revealed live. Cocktail reception into dinner and live music - 300 industry leaders in one purpose-built room.
The Signal at Chattanooga Choo Choo • Chattanooga, TN Register NowIndustry-defining keynotes, rapid-fire technology demos, and industry leaders networking in experiences across Chattanooga - plus the inaugural F3 Awards Dinner featuring the FreightTech and Shipper of Choice reveals.
The Signal at Chattanooga Choo Choo • Chattanooga, TN Register Now