









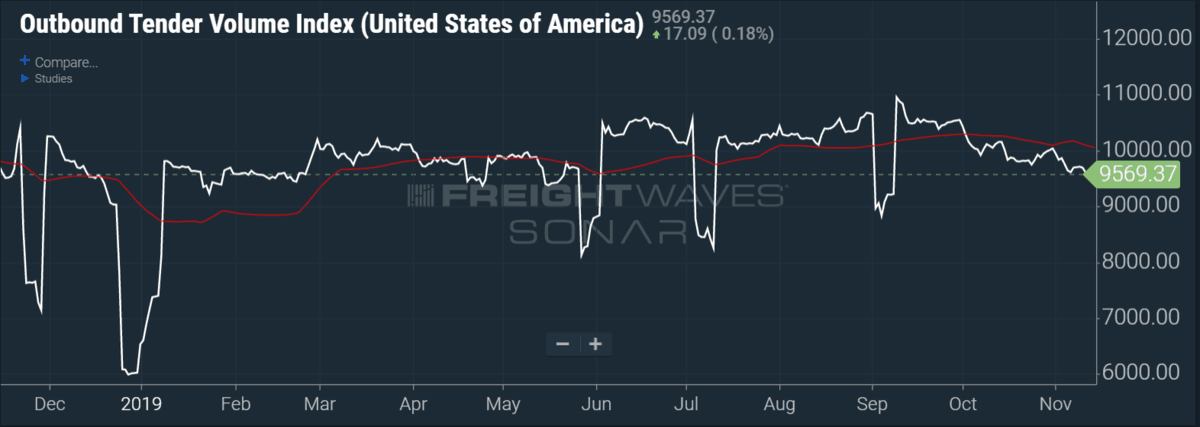
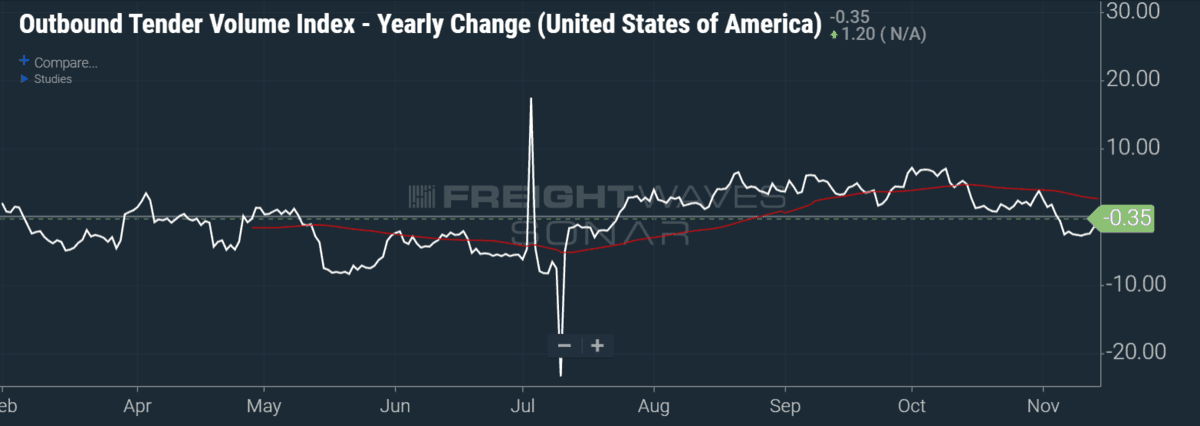
Outbound tender volumes (OTVI.USA) fell by 0.35% year-over-year this week and now sit well off the year-to-date high of 6.78% from early October. Volumes have been in a consistent downtrend for the last several weeks. Most importantly, this week’s negative results in volumes are the second straight week of breaking a nearly three-month “winning streak” of positive volumes dating back to late July, when OTVI first crossed over to positive on July 24.
Nationally, outbound tender volumes fell 0.35% year-over-year this week. Month-over-month volumes are tracking down 3.08%, while week-over-week volumes are down 1.29%. As we enter the heart of peak season, it seems fair to now question if we are going to actually have a peak season at all. This is a stark reversal from a month ago when things were looking up, but this can be a volatile index so all is not lost yet.
On a market-by-market basis, seven of the 15 major markets FreightWaves tracks were positive on a week-over-week basis. On the upside, Memphis, Tennessee, led the way, up 13.28%, followed by Cleveland, up 7.05%, and Chicago, up 6.16%. On the downside, the worst markets week-over-week included Ontario, California, down 6.86%, Miami, down 5.65%, and Fresno, California, down 5.65%.
National rejection rates rise this week
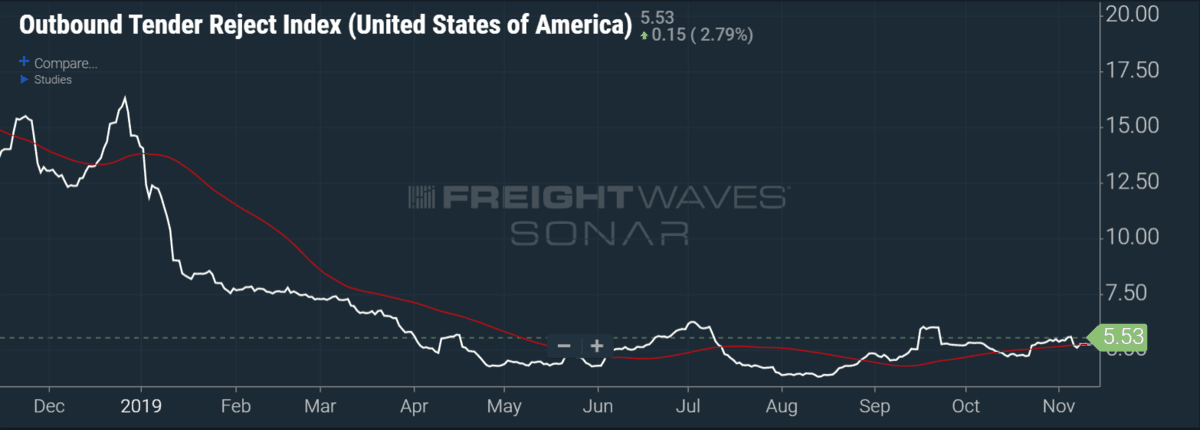
National tender rejections now sit at 5.53%. The tender rejection story has been much slower to develop, likely a reflection of stubbornly high capacity in the market. This week actually brought positive news on this front with rejections rising 44 basis points (bps) week-over-week.
OTRI.USA briefly broke above the 6% level for the first time since March back on Sept. 17, but has since taken a noticeable step back. On a month-over-month basis, rejections are up 8 bps, while year-over-year it is down 838 bps compared to 13.84% at this time last year. On a trending basis, OTRI.USA looks good but not great, having risen in 10 out of the last 13 weeks with tender rejections rising off of the 3.75% bottom experienced in mid-August. National tender rejections have moved above their 60-day moving average by 5.13%.
Year-over-year comparables for national rejection rates are still extraordinarily difficult due to the daunting 2018 numbers in which rejections never fell below double digits. As a result, on a year-over-year percentage basis, OTRI.USA is down 60%. As can be seen in the chart below, comparisons do not start to ease until the January and February time frame in 2020.
Brokerage Compliance Symposium
The day before F3. Every compliance issue you face - fraud exposure, carrier liability, FMCSA rules, cargo theft, insurance gaps - navigated by attorneys and operators defining best practices in a changing industry.
F3 Awards Dinner
The night before F3. FreightTech100 companies honored. FreightTech 25 and Shipper of Choice winners revealed live. Cocktail reception into dinner and live music - 300 industry leaders in one purpose-built room.
F3: Future of Freight Festival
Industry-defining keynotes, rapid-fire technology demos, and industry leaders networking in experiences across Chattanooga - plus the inaugural F3 Awards Dinner featuring the FreightTech and Shipper of Choice reveals.
The day before F3. Every compliance issue you face - fraud exposure, carrier liability, FMCSA rules, cargo theft, insurance gaps - navigated by attorneys and operators defining best practices in a changing industry.
The Signal at Chattanooga Choo Choo • Chattanooga, TN Register NowThe night before F3. FreightTech100 companies honored. FreightTech 25 and Shipper of Choice winners revealed live. Cocktail reception into dinner and live music - 300 industry leaders in one purpose-built room.
The Signal at Chattanooga Choo Choo • Chattanooga, TN Register NowIndustry-defining keynotes, rapid-fire technology demos, and industry leaders networking in experiences across Chattanooga - plus the inaugural F3 Awards Dinner featuring the FreightTech and Shipper of Choice reveals.
The Signal at Chattanooga Choo Choo • Chattanooga, TN Register Now