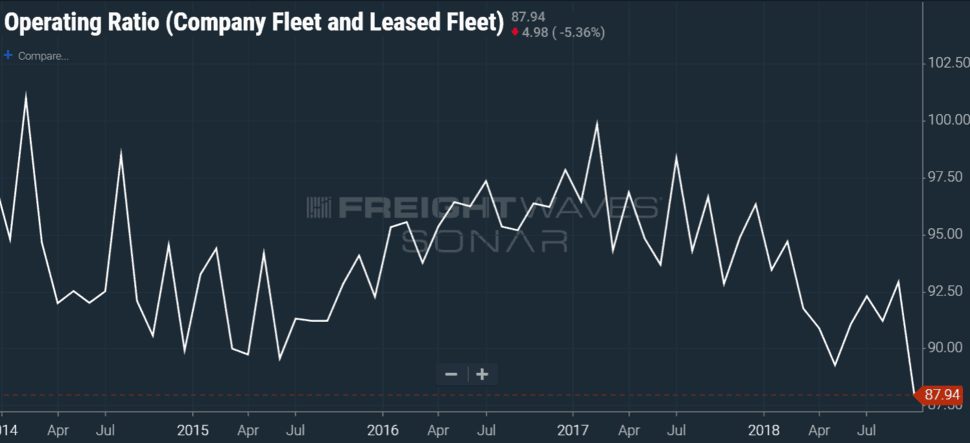
Asset based carrier operating ratios are falling into the 4th quarter despite cooling market. (SONAR chart of OPRAT.CFOO)
FREIGHTWAVES’ SONAR CHART OF THE WEEK (Dec 23 -Dec 30, 2018)
Chart of the Week: Truckload Carriers’ Association Best Practices Group operating ratio (SONAR:OPERAT.CFOO)
The average operating ratios (ORs) continue to fall into the 4th quarter of 2018. This is in drastic contrast to late 2017 when operating ratios climbed through the mid and upper 90s. This may not make sense to many who follow the freight market as late 2017 was considered a very volatile time and this year has been quite the opposite. So why would operating ratios drop this year as the market is cooling?
First, we should define what an operating ratio is. The operating ratio is the ratio of operating expenses to net sales. Operating expenses are the items that are required by the operation to generate revenue. For a trucking company this includes things like driver wages, maintenance, and various administration expenses. It does not include things like debt servicing and taxes.
The lower the operating ratio is the more efficient the company is said to be. This is because, fiscally speaking, the operation requires less money to generate revenue. The key to understanding why ORs increased in a hot market last year while decreasing in a cooling market this year is understanding that ORs are essentially measuring operating efficiency.
In 2017 carriers were as ill prepared for surging freight volumes as shippers. The fall of 2017 was filled with “black swan” events. Black swan events are occurrences that are extremely rare and unlikely that create large disruption. Last year’s hurricanes were black swans because no one can forecast what impact a hurricane will have prior to a few days from landfall.
Other things also occurred in the fall of 2018 that were not technically black swan events but a surging economy and better than expected retail sales that took UPS by surprise contributed to the freight market being out of balance.
Carriers must respond to these ebbs and flows of freight surges by re-positioning their trucks to cover the freight. The freight is not always in a convenient location. Fleets rushed to the Houston market to help the recovery and to rebuild for months after Harvey hit. There is not an abundance of freight heading out of the market which means there will be some amount of deadheading back out. Deadhead or empty miles do nothing but increase expenses for a carrier.
Another factor and less understood is the concept of pricing being too low at the end of 2017. Most of the contracts were based on rates developed at the end of 2016 which was a rough year for freight and the general economy. So carriers were operating on much thinner margins last year.
Most of the volume this fall has come from southern California and there have been no big disrupting events. Carriers have benefited from consistent freight patterns and elevated rates enabling them to get the best of both worlds, leading to increased operating efficiency and more revenue for the same work. If demand and volume continues to fall ORs will start to head back up as utilization becomes a factor.
About Indices presented in this article
(SONAR: OPRAT.CFOO) Operating Ratio – Company Fleet and Leased Fleet – The Truckload Carrier Association collects information from over 300 asset based carriers and reports certain metrics as benchmark data in SONAR. . Operating ratios are operating expenses reported as a percent of sales revenue. Interest and taxes are not included in the expenses. The company and leased fleet operating ratio includes both company driver and owner operator expenses and revenues. SONAR also has company fleet only (CF) and leased fleet (OO) reported individually, as well as brokerage (BR) and consolidated (CNS) organizations.
(About Chart of the Week
The FreightWaves Chart of the Week is a chart selection from SONAR that provides an interesting data point to describe the state of the freight markets. A chart is chosen from thousands of potential charts on SONAR to help participants visualize the freight market in real-time. Each week the Sultan of SONAR will post a chart, along with commentary live on the front-page. After that, the Chart of the Week will be archived on FreightWaves.com for future reference.
SONAR aggregates data from hundreds of sources, presenting the data in charts and maps and providing commentary on what freight market experts want to know about the industry- in real time.
The FreightWaves data-science and product teams are releasing new data-sets each week and enhancing the client experience.
To find out more about SONAR go here or to setup a demo click here.
Brokerage Compliance Symposium
The day before F3. Every compliance issue you face - fraud exposure, carrier liability, FMCSA rules, cargo theft, insurance gaps - navigated by attorneys and operators defining best practices in a changing industry.
F3 Awards Dinner
The night before F3. FreightTech100 companies honored. FreightTech 25 and Shipper of Choice winners revealed live. Cocktail reception into dinner and live music - 300 industry leaders in one purpose-built room.
F3: Future of Freight Festival
Industry-defining keynotes, rapid-fire technology demos, and industry leaders networking in experiences across Chattanooga - plus the inaugural F3 Awards Dinner featuring the FreightTech and Shipper of Choice reveals.
The day before F3. Every compliance issue you face - fraud exposure, carrier liability, FMCSA rules, cargo theft, insurance gaps - navigated by attorneys and operators defining best practices in a changing industry.
The Signal at Chattanooga Choo Choo • Chattanooga, TN Register NowThe night before F3. FreightTech100 companies honored. FreightTech 25 and Shipper of Choice winners revealed live. Cocktail reception into dinner and live music - 300 industry leaders in one purpose-built room.
The Signal at Chattanooga Choo Choo • Chattanooga, TN Register NowIndustry-defining keynotes, rapid-fire technology demos, and industry leaders networking in experiences across Chattanooga - plus the inaugural F3 Awards Dinner featuring the FreightTech and Shipper of Choice reveals.
The Signal at Chattanooga Choo Choo • Chattanooga, TN Register Now